Estimated Value: $796,000 - $874,000
3
Beds
2
Baths
1,403
Sq Ft
$597/Sq Ft
Est. Value
About This Home
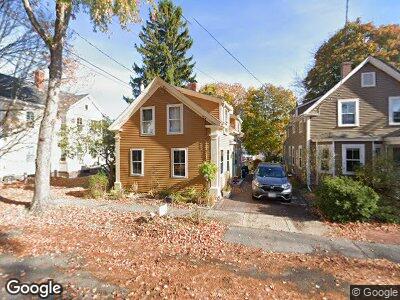
This home is located at 6 Walnut St, Newburyport, MA 01950 and is currently estimated at $838,063, approximately $597 per square foot. 6 Walnut St is a home located in Essex County with nearby schools including Francis T. Bresnahan Elementary School, Edward G. Molin Elementary School, and Rupert A. Nock Middle School.
Ownership History
Date
Name
Owned For
Owner Type
Purchase Details
Closed on
Nov 22, 2000
Sold by
Bennett Stanford H and Bennett Marilyn P
Bought by
Labaugh Betty M
Current Estimated Value
Purchase Details
Closed on
Nov 20, 1998
Sold by
Desimone Gary S and Desimone Shelley A
Bought by
Bennett Stanford A and Benneett Marilyn P
Purchase Details
Closed on
Oct 12, 1995
Sold by
Hatic Halid and Borger Wendy
Bought by
Desimone Gary and Carozza Shelley
Purchase Details
Closed on
Sep 23, 1992
Sold by
Howard Scott A
Bought by
Hatic Halid Edhem and Borger Wendy A
Purchase Details
Closed on
Jul 28, 1989
Sold by
Coussoule Gregory
Bought by
Howard Scott
Purchase Details
Closed on
Sep 12, 1988
Sold by
Fortin William R
Bought by
Coussoule Greogry L
Create a Home Valuation Report for This Property
The Home Valuation Report is an in-depth analysis detailing your home's value as well as a comparison with similar homes in the area
Home Values in the Area
Average Home Value in this Area
Purchase History
| Date | Buyer | Sale Price | Title Company |
|---|---|---|---|
| Labaugh Betty M | $329,913 | -- | |
| Bennett Stanford A | $247,900 | -- | |
| Desimone Gary | $182,500 | -- | |
| Hatic Halid Edhem | $150,000 | -- | |
| Howard Scott | $152,500 | -- | |
| Coussoule Greogry L | $100,000 | -- |
Source: Public Records
Mortgage History
| Date | Status | Borrower | Loan Amount |
|---|---|---|---|
| Open | Labaugh Betty M | $265,000 | |
| Closed | Labaugh Betty M | $174,000 | |
| Closed | Labaugh Betty M | $176,500 | |
| Closed | Labaugh Betty M | $158,540 | |
| Closed | Coussoule Greogry L | $213,000 | |
| Closed | Coussoule Greogry L | $175,000 |
Source: Public Records
Tax History Compared to Growth
Tax History
| Year | Tax Paid | Tax Assessment Tax Assessment Total Assessment is a certain percentage of the fair market value that is determined by local assessors to be the total taxable value of land and additions on the property. | Land | Improvement |
|---|---|---|---|---|
| 2025 | $7,767 | $810,800 | $357,600 | $453,200 |
| 2024 | $7,555 | $757,800 | $325,100 | $432,700 |
| 2023 | $7,022 | $653,800 | $282,700 | $371,100 |
| 2022 | $6,562 | $546,400 | $235,600 | $310,800 |
| 2021 | $6,340 | $501,600 | $214,100 | $287,500 |
| 2020 | $6,441 | $501,600 | $214,100 | $287,500 |
| 2019 | $6,235 | $476,700 | $214,100 | $262,600 |
| 2018 | $5,944 | $448,300 | $204,000 | $244,300 |
| 2017 | $5,898 | $438,500 | $194,200 | $244,300 |
| 2016 | $5,908 | $441,200 | $185,000 | $256,200 |
| 2015 | $5,667 | $424,800 | $185,000 | $239,800 |
Source: Public Records
Map
Nearby Homes
- 286 Merrimac St Unit A
- 266 Merrimac St Unit F
- 26 Munroe St Unit 1
- 240 Merrimac St Unit 3
- 52 Warren St
- 27 Warren St Unit 1
- 4 Arlington St Unit A
- 9-11 Kent St Unit B
- 177 Merrimac St Unit 1
- 11 Congress St
- 14 Columbus Ave
- 2 Boardman St
- 212 High St
- 126 Merrimac St Unit 11
- 41 Washington St Unit C
- 10 Hunter Dr
- 14 Dexter Ln Unit A
- 38 Toppans Ln Unit 2
- 184 High St
- 185 High St