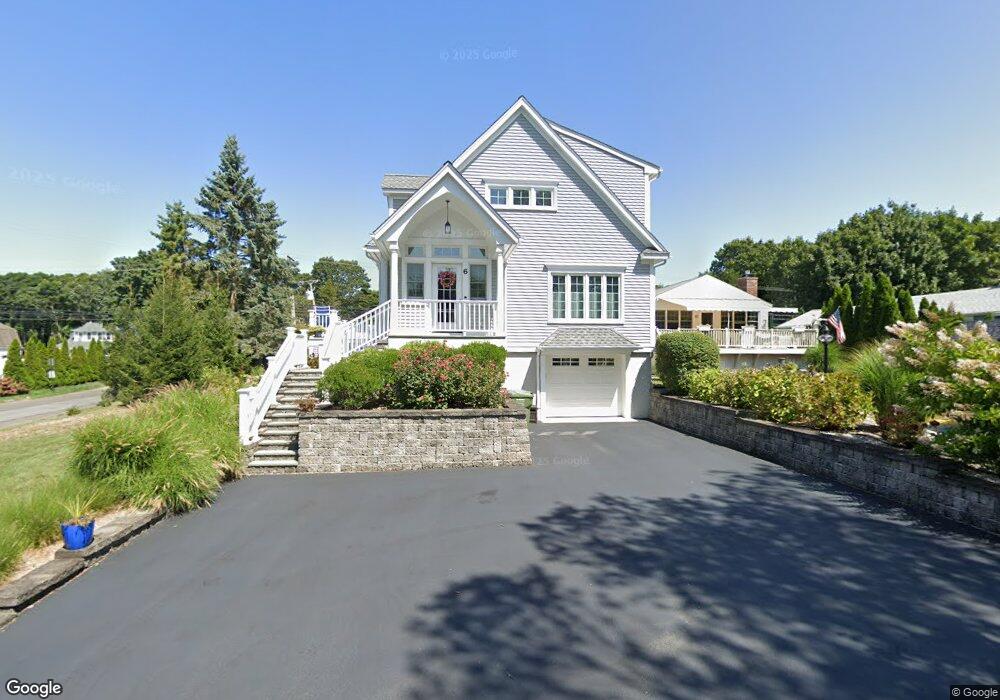
6 Wangum Rd Westbrook, CT 06498
Estimated Value: $940,000 - $1,076,000
3
Beds
1
Bath
2,501
Sq Ft
$400/Sq Ft
Est. Value
About This Home
This home is located at 6 Wangum Rd, Westbrook, CT 06498 and is currently estimated at $1,001,575, approximately $400 per square foot. 6 Wangum Rd is a home located in Middlesex County with nearby schools including Daisy Ingraham School, Westbrook Middle School, and Westbrook High School.
Ownership History
Date
Name
Owned For
Owner Type
Purchase Details
Closed on
May 10, 2023
Sold by
Oliver Karen M and Oliver Peter S
Bought by
Oliver Ft and Oliver
Current Estimated Value
Purchase Details
Closed on
Jun 28, 2011
Sold by
Oliver Karen and Oliver Peter
Bought by
Oliver Karen and Oliver Peter
Purchase Details
Closed on
Sep 17, 2010
Sold by
Oliver Karen
Bought by
Oliver Karen and Oliver Peter
Create a Home Valuation Report for This Property
The Home Valuation Report is an in-depth analysis detailing your home's value as well as a comparison with similar homes in the area
Home Values in the Area
Average Home Value in this Area
Purchase History
| Date | Buyer | Sale Price | Title Company |
|---|---|---|---|
| Oliver Ft | -- | None Available | |
| Oliver Karen | -- | -- | |
| Oliver Karen | -- | -- |
Source: Public Records
Tax History
| Year | Tax Paid | Tax Assessment Tax Assessment Total Assessment is a certain percentage of the fair market value that is determined by local assessors to be the total taxable value of land and additions on the property. | Land | Improvement |
|---|---|---|---|---|
| 2025 | $11,496 | $510,950 | $170,140 | $340,810 |
| 2024 | $11,088 | $510,950 | $170,140 | $340,810 |
| 2023 | $10,893 | $510,950 | $170,140 | $340,810 |
| 2022 | $10,607 | $510,950 | $170,140 | $340,810 |
| 2021 | $11,190 | $447,580 | $122,690 | $324,890 |
| 2020 | $11,190 | $447,580 | $122,690 | $324,890 |
| 2019 | $11,042 | $447,580 | $122,690 | $324,890 |
| 2018 | $10,908 | $447,580 | $122,690 | $324,890 |
| 2017 | $10,908 | $447,580 | $122,690 | $324,890 |
| 2016 | $10,412 | $449,938 | $117,240 | $332,698 |
| 2015 | $10,128 | $449,938 | $117,240 | $332,698 |
| 2014 | $9,804 | $449,938 | $117,240 | $332,698 |
Source: Public Records
Map
Nearby Homes
- 86 Grove Beach Rd N
- 14 Chestnut Dr
- 5 Meadow Point Rd
- 40 Hammock Rd S
- 5 Robin Ln
- 40 Beach Rd
- 0 Boston Post Rd Unit 24080344
- 407 Grove Beach Rd N
- 0 Causeway
- 176 Shore Rd
- 280 E Main St Unit E2
- 144 Shore Rd
- 328 Hammock Rd N
- 37 Nolin Rd
- 951 Old Clinton Rd Unit 15
- 59 Old Post Rd Unit F1
- 1020 Old Clinton Rd
- 75 Shore Rd
- 81 Founders Village Unit 81
- 39 Founders Village Unit 39
Your Personal Tour Guide
Ask me questions while you tour the home.