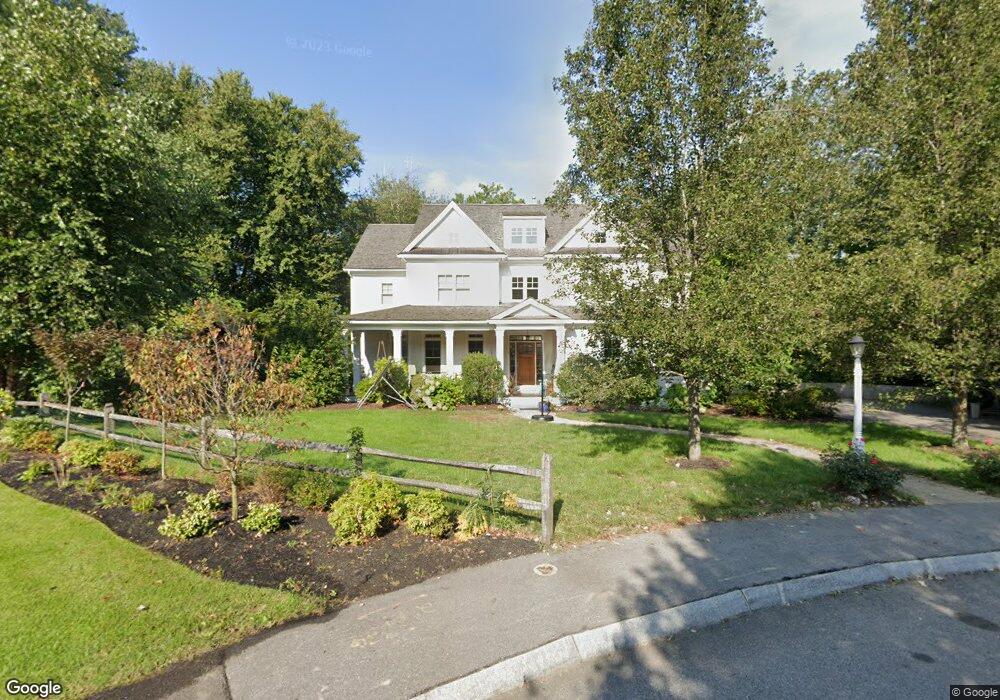
6 Waterview Ln Natick, MA 01760
Estimated Value: $1,619,000 - $2,014,000
4
Beds
4
Baths
3,600
Sq Ft
$515/Sq Ft
Est. Value
About This Home
This home is located at 6 Waterview Ln, Natick, MA 01760 and is currently estimated at $1,853,762, approximately $514 per square foot. 6 Waterview Ln is a home located in Middlesex County with nearby schools including Natick High School, Memorial Elementary School, and J F Kennedy Middle School.
Ownership History
Date
Name
Owned For
Owner Type
Purchase Details
Closed on
Oct 3, 2013
Sold by
Magit David P and Magit Karen F
Bought by
Magit Ft and Magit David P
Current Estimated Value
Purchase Details
Closed on
Mar 5, 2010
Sold by
33 Glen St Llc
Bought by
Magit David P and Magit Karen F
Home Financials for this Owner
Home Financials are based on the most recent Mortgage that was taken out on this home.
Original Mortgage
$839,200
Interest Rate
5%
Mortgage Type
Purchase Money Mortgage
Create a Home Valuation Report for This Property
The Home Valuation Report is an in-depth analysis detailing your home's value as well as a comparison with similar homes in the area
Home Values in the Area
Average Home Value in this Area
Purchase History
| Date | Buyer | Sale Price | Title Company |
|---|---|---|---|
| Magit Ft | -- | -- | |
| Magit David P | $329,000 | -- |
Source: Public Records
Mortgage History
| Date | Status | Borrower | Loan Amount |
|---|---|---|---|
| Previous Owner | Magit David P | $839,200 |
Source: Public Records
Tax History Compared to Growth
Tax History
| Year | Tax Paid | Tax Assessment Tax Assessment Total Assessment is a certain percentage of the fair market value that is determined by local assessors to be the total taxable value of land and additions on the property. | Land | Improvement |
|---|---|---|---|---|
| 2025 | $18,946 | $1,584,100 | $558,900 | $1,025,200 |
| 2024 | $18,323 | $1,494,500 | $527,800 | $966,700 |
| 2023 | $17,290 | $1,367,900 | $528,100 | $839,800 |
| 2022 | $16,165 | $1,211,800 | $435,500 | $776,300 |
| 2021 | $15,461 | $1,136,000 | $411,600 | $724,400 |
| 2020 | $15,217 | $1,118,100 | $393,700 | $724,400 |
| 2019 | $14,211 | $1,118,100 | $393,700 | $724,400 |
| 2018 | $13,988 | $1,071,900 | $376,600 | $695,300 |
| 2017 | $14,133 | $1,047,700 | $364,900 | $682,800 |
| 2016 | $14,129 | $1,041,200 | $364,900 | $676,300 |
| 2015 | $13,602 | $984,200 | $364,900 | $619,300 |
Source: Public Records
Map
Nearby Homes
- 83 Eliot St
- 8 Warren Rd
- 91 Glen St
- 29 Water St
- 18 Phillips Pond Rd
- 104 Glen St
- 21 Eliot St
- 39 Davis Brook Dr
- 94 Woodland St
- 12 Winding River Cir
- 182 Winding River Rd
- 21 Harvest Moon Dr
- 10 Sundance Way
- 5 Deer Path
- 60 Locust Ln
- 39 Indian Ridge Rd
- 192 Pond Rd
- 25 Yorkshire Rd
- 55 Ridge Hill Farm Rd
- 15 Penobscot Rd