
Seller's Agent in 2025
Karen Goins
RE/MAX Suburban
(847) 208-9192
176 Total Sales
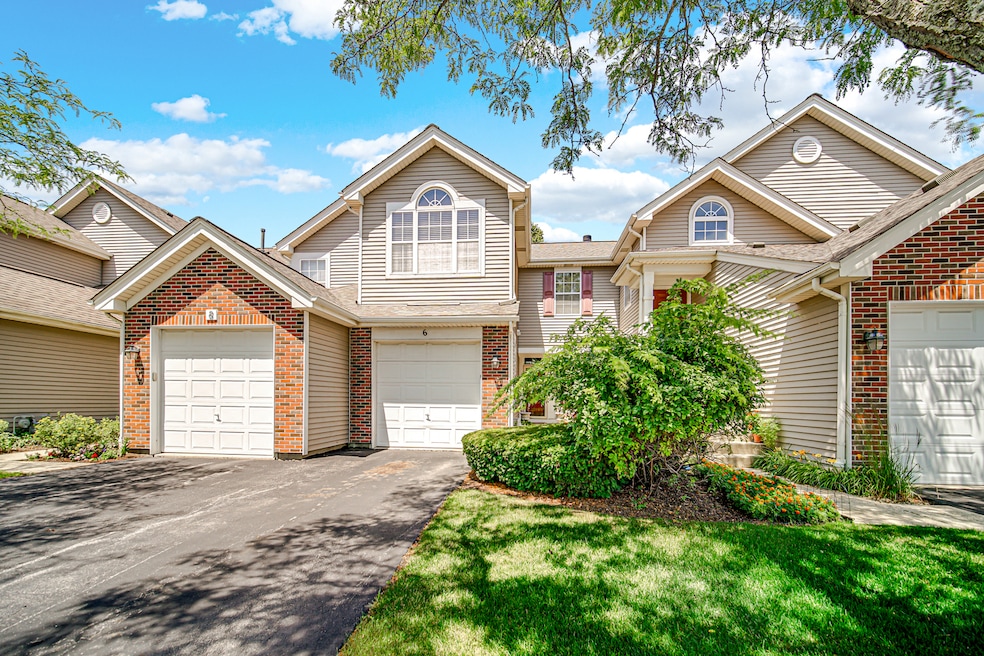
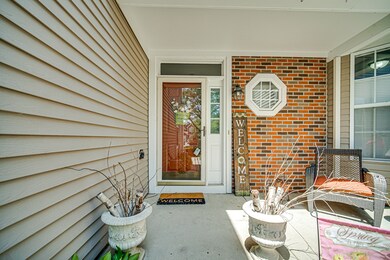
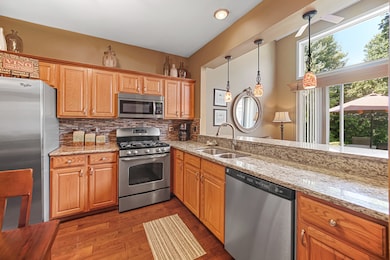
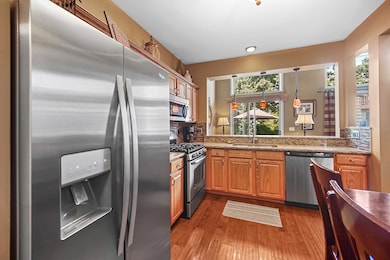
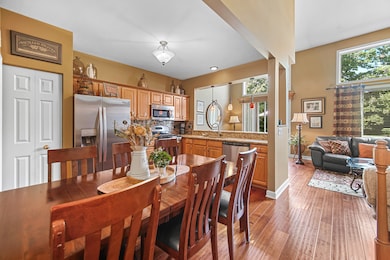
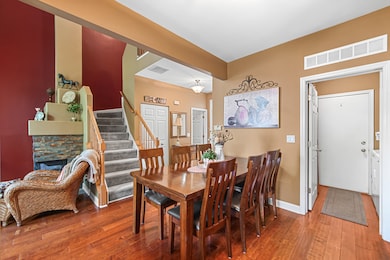
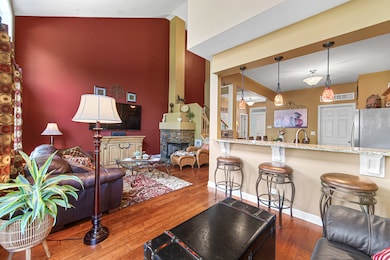
Custom Driftwood Model in Sought-After Willoughby Farms! Welcome to this beautifully maintained 3-bedroom, 1.5-bath Driftwood model townhome nestled in a quiet cul-de-sac in popular Willoughby Farms. This inviting townhome features a stunning 2-story living area with an open-concept layout, cozy stone fireplace and engineered hardwood flooring throughout the main level. The open and expanded, eat-in kitchen is a standout with granite countertops, mosaic backsplash, stainless steel appliances, crown molding on cabinetry, and a spacious pantry. Powder room features stone accents & granite vanity. Upstairs, you'll find a convenient Jack & Jill bath and a generous primary bedroom with a walk-in & double closet. 2 more bedrooms with luxury plank flooring, the 3rd bedroom is being used as a den. There's no shortage of storage with large closets, under-stair, garage and attic storage. Enjoy outdoor living with a private front porch and a secluded back patio. New hot water tank just installed May 2025. Roof is 3 - 5 years new. Perfectly located just a short walk to the park & K - 8 school and only minutes from shopping, dining, the Longmeadow Bridge, and I-90. Move-in ready and loaded with charm-this is the one you've been waiting for!
Last Agent to Sell the Property
RE/MAX Suburban License #475125256 Listed on: 06/29/2025
| Date | Type | Sale Price | Title Company |
|---|---|---|---|
| Warranty Deed | $280,000 | None Listed On Document | |
| Warranty Deed | $113,000 | Chicago Title Insurance Co | |
| Warranty Deed | $116,500 | Chicago Title Insurance Co |
| Date | Status | Loan Amount | Loan Type |
|---|---|---|---|
| Open | $249,900 | New Conventional | |
| Previous Owner | $101,700 | No Value Available | |
| Previous Owner | $111,550 | FHA |
| Date | Event | Price | List to Sale | Price per Sq Ft |
|---|---|---|---|---|
| 08/27/2025 08/27/25 | Sold | $279,900 | 0.0% | $215 / Sq Ft |
| 07/08/2025 07/08/25 | Pending | -- | -- | -- |
| 06/29/2025 06/29/25 | Price Changed | $279,900 | 0.0% | $215 / Sq Ft |
| 06/29/2025 06/29/25 | For Sale | $279,900 | -- | $215 / Sq Ft |
| Year | Tax Paid | Tax Assessment Tax Assessment Total Assessment is a certain percentage of the fair market value that is determined by local assessors to be the total taxable value of land and additions on the property. | Land | Improvement |
|---|---|---|---|---|
| 2024 | $4,608 | $68,611 | $8,371 | $60,240 |
| 2023 | $4,373 | $61,734 | $7,532 | $54,202 |
| 2022 | $4,236 | $56,692 | $7,532 | $49,160 |
| 2021 | $4,098 | $53,529 | $7,112 | $46,417 |
| 2020 | $4,013 | $52,325 | $6,952 | $45,373 |
| 2019 | $3,878 | $49,673 | $6,600 | $43,073 |
| 2018 | $3,644 | $45,522 | $6,469 | $39,053 |
| 2017 | $3,478 | $42,583 | $6,051 | $36,532 |
| 2016 | $3,557 | $41,231 | $5,859 | $35,372 |
| 2015 | $4,326 | $32,874 | $5,490 | $27,384 |
| 2014 | $4,326 | $31,966 | $5,338 | $26,628 |
| 2013 | $4,326 | $39,319 | $5,501 | $33,818 |
Seller's Agent in 2025
Karen Goins
RE/MAX Suburban
(847) 208-9192
176 Total Sales
Buyer's Agent in 2025
Chris Popp
Baird Warner
(815) 914-1008
85 Total Sales
Source: Midwest Real Estate Data (MRED)
MLS Number: 12402764
APN: 03-05-178-064
Disclaimer: Certain information contained herein is derived from information provided by parties other than Homes.com. All information provided is deemed reliable, but is not guaranteed to be accurate and should be independently verified.
![]() Based on information submitted to the MLS GRID. All data is obtained from various sources and may not have been verified by broker or MLS GRID. Supplied Open House Information is subject to change without notice. All information should be independently reviewed and verified for accuracy. Properties may or may not be listed by the office/agent presenting the information. Some IDX listings have been excluded from this website.
Based on information submitted to the MLS GRID. All data is obtained from various sources and may not have been verified by broker or MLS GRID. Supplied Open House Information is subject to change without notice. All information should be independently reviewed and verified for accuracy. Properties may or may not be listed by the office/agent presenting the information. Some IDX listings have been excluded from this website.
Based on information submitted to the MLS GRID
Ask me questions while you tour the home.