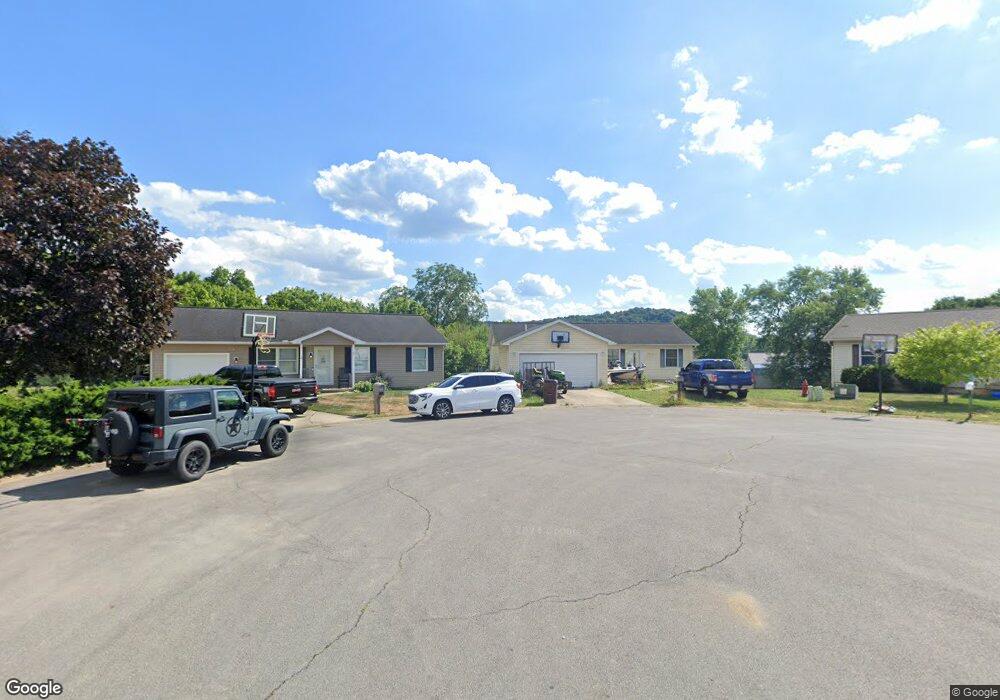
6 Willow Creek Rd Chillicothe, OH 45601
Estimated Value: $206,000 - $261,000
3
Beds
2
Baths
1,200
Sq Ft
$195/Sq Ft
Est. Value
About This Home
This home is located at 6 Willow Creek Rd, Chillicothe, OH 45601 and is currently estimated at $234,137, approximately $195 per square foot. 6 Willow Creek Rd is a home located in Ross County with nearby schools including Unioto Elementary School, Unioto Middle School, and Unioto High School.
Ownership History
Date
Name
Owned For
Owner Type
Purchase Details
Closed on
Apr 18, 2011
Sold by
Fifth Third Mortgage Company
Bought by
Wood Whitney L
Current Estimated Value
Home Financials for this Owner
Home Financials are based on the most recent Mortgage that was taken out on this home.
Original Mortgage
$60,325
Interest Rate
4.8%
Mortgage Type
Seller Take Back
Purchase Details
Closed on
Mar 7, 2011
Sold by
Martin Jack R and Martin Jennifer L
Bought by
Fifth Third Mortgage Company
Home Financials for this Owner
Home Financials are based on the most recent Mortgage that was taken out on this home.
Original Mortgage
$60,325
Interest Rate
4.8%
Mortgage Type
Seller Take Back
Purchase Details
Closed on
Nov 3, 2006
Sold by
Frontier Community Services Inc
Bought by
Martin Jack R and Martin Jennifer
Home Financials for this Owner
Home Financials are based on the most recent Mortgage that was taken out on this home.
Original Mortgage
$96,000
Interest Rate
6.45%
Mortgage Type
Purchase Money Mortgage
Create a Home Valuation Report for This Property
The Home Valuation Report is an in-depth analysis detailing your home's value as well as a comparison with similar homes in the area
Home Values in the Area
Average Home Value in this Area
Purchase History
| Date | Buyer | Sale Price | Title Company |
|---|---|---|---|
| Wood Whitney L | $69,000 | Title First | |
| Fifth Third Mortgage Company | $72,000 | Attorney | |
| Martin Jack R | $138,400 | Great Seal Title Agency |
Source: Public Records
Mortgage History
| Date | Status | Borrower | Loan Amount |
|---|---|---|---|
| Previous Owner | Wood Whitney L | $60,325 | |
| Previous Owner | Martin Jack R | $96,000 |
Source: Public Records
Tax History Compared to Growth
Tax History
| Year | Tax Paid | Tax Assessment Tax Assessment Total Assessment is a certain percentage of the fair market value that is determined by local assessors to be the total taxable value of land and additions on the property. | Land | Improvement |
|---|---|---|---|---|
| 2024 | $2,100 | $59,420 | $13,710 | $45,710 |
| 2023 | $2,100 | $59,420 | $13,710 | $45,710 |
| 2022 | $2,145 | $59,420 | $13,710 | $45,710 |
| 2021 | $1,819 | $46,950 | $11,060 | $35,890 |
| 2020 | $1,832 | $46,950 | $11,060 | $35,890 |
| 2019 | $1,778 | $46,950 | $11,060 | $35,890 |
| 2018 | $1,597 | $41,320 | $11,060 | $30,260 |
| 2017 | $1,599 | $41,320 | $11,060 | $30,260 |
| 2016 | $1,558 | $41,320 | $11,060 | $30,260 |
| 2015 | $1,557 | $40,920 | $11,060 | $29,860 |
| 2014 | $1,519 | $40,920 | $11,060 | $29,860 |
| 2013 | $1,527 | $40,920 | $11,060 | $29,860 |
Source: Public Records
Map
Nearby Homes
- 2083 Anderson Station Rd
- 18 Sarah Ct
- 1036 Clinton Rd
- 559 Golfview Dr
- 365 Golfview Dr
- 12690 Pleasant Valley Rd
- 313 Goodale Dr
- 320 Summerhill Dr
- 13223 Pleasant Valley Rd
- 88 Fruit Hill Dr
- 310 Almahurst Dr
- 102 Franklin Cir
- 2153 Egypt Pike
- 11303 County Road 550
- 265 Brookside Dr
- 54 Moccasin Dr
- 45 Custer Dr
- 23 Shawnee Dr
- 25 Woodland Way
- 14 Fruit Hill Dr
- 10 Willow Creek Rd
- 3 Willow Creek Rd
- 1909 Anderson Station Rd
- 14 Willow Creek Rd
- 1927 Anderson Station Rd
- 28 Willow Creek Rd
- 9 Willow Creek Rd
- 17 Willow Court Rd
- 17 Willow Creek Rd
- 42 Willow Creek Rd
- 32 Creek View Dr
- 29 Willow Creek Rd
- 68 Creek View Dr
- 44 Creek View Dr
- 80 Creek View Dr
- 20 Creek View Dr
- 88 Creek View Dr
- 66 W Patrician Ct
- 61 W Patrician Ct
- 41 Willow Creek Rd