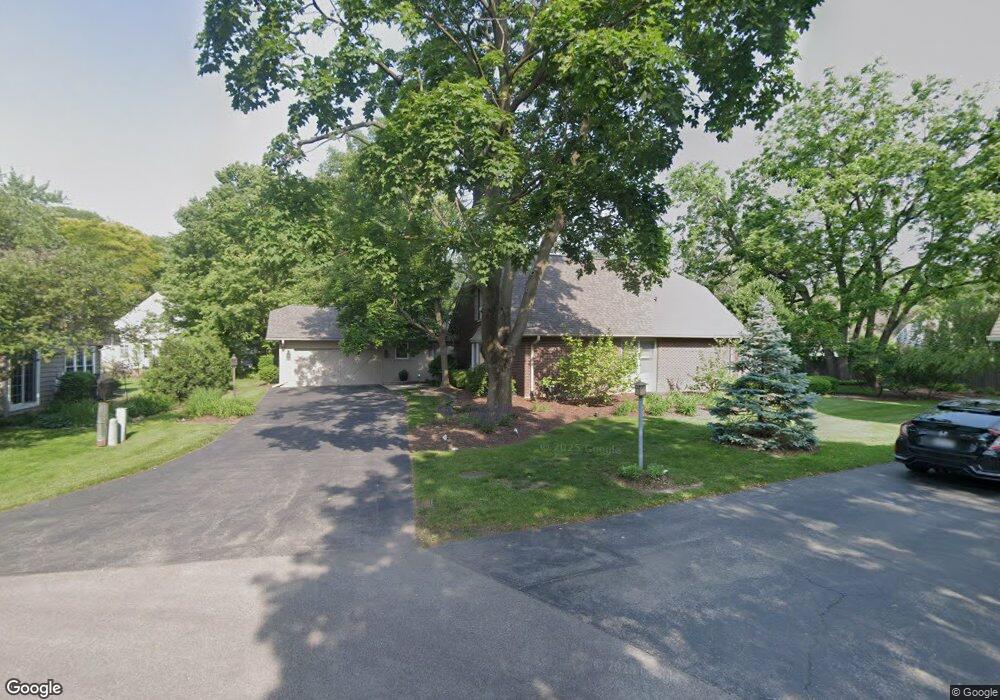
6 Woodbine Rd Rolling Meadows, IL 60008
Creekside NeighborhoodEstimated Value: $725,000 - $750,000
5
Beds
3
Baths
3,025
Sq Ft
$243/Sq Ft
Est. Value
About This Home
This home is located at 6 Woodbine Rd, Rolling Meadows, IL 60008 and is currently estimated at $734,426, approximately $242 per square foot. 6 Woodbine Rd is a home located in Cook County with nearby schools including Central Road Elementary School, Plum Grove Jr High School, and William Fremd High School.
Ownership History
Date
Name
Owned For
Owner Type
Purchase Details
Closed on
Oct 2, 2006
Sold by
Freeman John C and Freeman Wendy M
Bought by
Freeman John C and John C Freeman Revocable Trust
Current Estimated Value
Purchase Details
Closed on
Nov 24, 2001
Sold by
Freeman John C and Freeman Wendy M
Bought by
Freeman John C and Freeman Wendy M
Purchase Details
Closed on
Jul 2, 2001
Sold by
Fellers Janice K
Bought by
Freeman John C and Freeman Wendy M
Home Financials for this Owner
Home Financials are based on the most recent Mortgage that was taken out on this home.
Original Mortgage
$275,000
Outstanding Balance
$101,034
Interest Rate
7.14%
Estimated Equity
$633,392
Purchase Details
Closed on
Dec 17, 1996
Sold by
Fellers Janice K
Bought by
Fellers Janice K and Janice K Fellers Trust
Create a Home Valuation Report for This Property
The Home Valuation Report is an in-depth analysis detailing your home's value as well as a comparison with similar homes in the area
Home Values in the Area
Average Home Value in this Area
Purchase History
We collect this data history from publicly available records. To have your information removed, we recommend requesting removal directly through your county’s website.
| Date | Buyer | Sale Price | Title Company |
|---|---|---|---|
| Freeman John C | -- | None Available | |
| Freeman John C | -- | Chicago Title Insurance Co | |
| Freeman John C | $392,000 | -- | |
| Fellers Janice K | -- | -- |
Source: Public Records
Mortgage History
We collect this data history from publicly available records. To have your information removed, we recommend requesting removal directly through your county’s website.
| Date | Status | Borrower | Loan Amount |
|---|---|---|---|
| Open | Freeman John C | $275,000 | |
| Closed | Freeman John C | $38,520 |
Source: Public Records
Tax History
| Year | Tax Paid | Tax Assessment Tax Assessment Total Assessment is a certain percentage of the fair market value that is determined by local assessors to be the total taxable value of land and additions on the property. | Land | Improvement |
|---|---|---|---|---|
| 2025 | $15,055 | $63,000 | $8,190 | $54,810 |
| 2024 | $15,055 | $51,000 | $6,930 | $44,070 |
| 2023 | $14,463 | $51,000 | $6,930 | $44,070 |
| 2022 | $14,463 | $51,000 | $6,930 | $44,070 |
| 2021 | $13,032 | $41,451 | $4,410 | $37,041 |
| 2020 | $12,901 | $41,451 | $4,410 | $37,041 |
| 2019 | $12,968 | $46,315 | $4,410 | $41,905 |
| 2018 | $15,387 | $49,394 | $4,095 | $45,299 |
| 2017 | $15,091 | $49,394 | $4,095 | $45,299 |
| 2016 | $14,315 | $49,394 | $4,095 | $45,299 |
| 2015 | $13,326 | $43,467 | $3,780 | $39,687 |
| 2014 | $13,057 | $43,467 | $3,780 | $39,687 |
| 2013 | $12,716 | $43,467 | $3,780 | $39,687 |
Source: Public Records
Map
Nearby Homes
- 3946 Balmoral Ct Unit 6
- 2 Dogwood Rd
- 3107 Falcon Ct W
- 4233 Oaksbury Ln
- 3100 Falcon Ct W
- 3000 California Ave
- 3204 Owl Dr
- 2600 Brookwood Way Dr Unit 114
- 2600 Brookwood Way Dr Unit 206
- 3265 Kirchoff Rd Unit 127
- 3265 Kirchoff Rd Unit 116
- 503 Lexington Ln
- 409 Lexington Ln
- 305 Lexington Ln
- 3135 Town Square Dr Unit 104
- 2814 Cardinal Dr
- 4795 Woodcliff Ln
- 3125 Town Square Dr Unit 405
- 2401 Rohlwing Rd
- 304 S Circle Dr Unit 4
- 8 Woodbine Rd
- 4 Woodbine Rd
- 4 Manomet on Auburn
- 3 Manomet on Auburn
- 16 Attleboro on Auburn
- 3 Burning Tree Rd
- 3 Hampton on Auburn
- 6 Attleboro on Auburn
- 1 Attleboro on Auburn
- 2 Manomet on Auburn
- 3 Woodbine Rd
- 1 Manomet on Auburn
- 5 Woodbine Rd
- 1 Hampton on Auburn
- 4 Hampton on Auburn
- 14 Attleboro on Auburn
- 6 Burning Tree Rd
- 2 Attleboro on Auburn
- 8 Attleboro on Auburn
- 2 Woodbine Rd
Your Personal Tour Guide
Ask me questions while you tour the home.