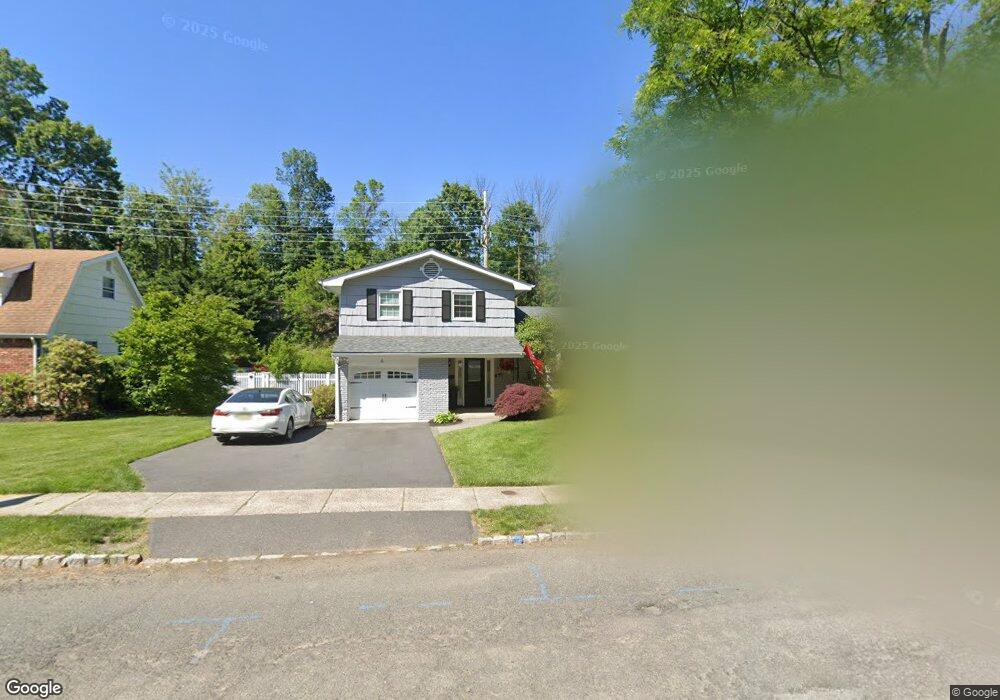
6 Woodland Rd Chatham, NJ 07928
Estimated Value: $918,000 - $1,215,000
--
Bed
--
Bath
1,689
Sq Ft
$604/Sq Ft
Est. Value
About This Home
This home is located at 6 Woodland Rd, Chatham, NJ 07928 and is currently estimated at $1,019,743, approximately $603 per square foot. 6 Woodland Rd is a home located in Morris County with nearby schools including Chatham High School, St. Patrick School, and ECLC of New Jersey.
Ownership History
Date
Name
Owned For
Owner Type
Purchase Details
Closed on
May 25, 2021
Sold by
Helman Bruce and Helman Julie M
Bought by
Kumar Sanjeev and Yadav Anjali
Current Estimated Value
Home Financials for this Owner
Home Financials are based on the most recent Mortgage that was taken out on this home.
Original Mortgage
$822,375
Interest Rate
2.9%
Mortgage Type
New Conventional
Purchase Details
Closed on
Feb 26, 2004
Sold by
Seyler Dominique
Bought by
Smith David and Smith Jennifer
Home Financials for this Owner
Home Financials are based on the most recent Mortgage that was taken out on this home.
Original Mortgage
$328,000
Interest Rate
5.62%
Create a Home Valuation Report for This Property
The Home Valuation Report is an in-depth analysis detailing your home's value as well as a comparison with similar homes in the area
Home Values in the Area
Average Home Value in this Area
Purchase History
| Date | Buyer | Sale Price | Title Company |
|---|---|---|---|
| Kumar Sanjeev | $900,245 | Weichert Title Agency | |
| Smith David | $410,000 | -- |
Source: Public Records
Mortgage History
| Date | Status | Borrower | Loan Amount |
|---|---|---|---|
| Previous Owner | Kumar Sanjeev | $822,375 | |
| Previous Owner | Smith David | $328,000 |
Source: Public Records
Tax History Compared to Growth
Tax History
| Year | Tax Paid | Tax Assessment Tax Assessment Total Assessment is a certain percentage of the fair market value that is determined by local assessors to be the total taxable value of land and additions on the property. | Land | Improvement |
|---|---|---|---|---|
| 2025 | $12,597 | $778,100 | $478,100 | $300,000 |
| 2024 | $12,092 | $778,100 | $478,100 | $300,000 |
| 2023 | $12,092 | $778,100 | $478,100 | $300,000 |
| 2022 | $10,065 | $471,000 | $323,900 | $147,100 |
| 2021 | $10,065 | $471,000 | $323,900 | $147,100 |
| 2020 | $9,980 | $471,000 | $323,900 | $147,100 |
| 2019 | $9,910 | $471,000 | $323,900 | $147,100 |
| 2018 | $9,632 | $471,000 | $323,900 | $147,100 |
| 2017 | $9,354 | $471,000 | $323,900 | $147,100 |
| 2016 | $9,026 | $466,700 | $323,900 | $142,800 |
| 2015 | $8,919 | $466,700 | $323,900 | $142,800 |
| 2014 | $8,853 | $466,700 | $323,900 | $142,800 |
Source: Public Records
Map
Nearby Homes