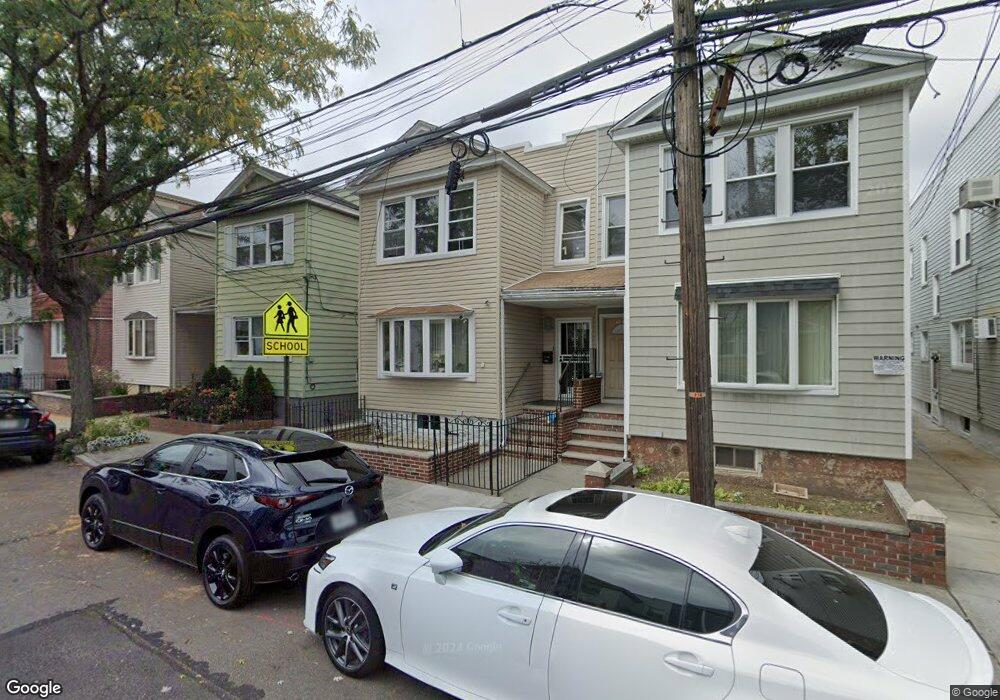
60-79 60th Rd Unit 1 Flushing, NY 11378
Maspeth NeighborhoodEstimated Value: $838,945 - $1,110,000
3
Beds
1
Bath
1,804
Sq Ft
$558/Sq Ft
Est. Value
About This Home
This home is located at 60-79 60th Rd Unit 1, Flushing, NY 11378 and is currently estimated at $1,006,736, approximately $558 per square foot. 60-79 60th Rd Unit 1 is a home located in Queens County with nearby schools including P.S. 153 Maspeth, IS 73 - The Frank Sansivieri School, and Grover Cleveland High School.
Ownership History
Date
Name
Owned For
Owner Type
Purchase Details
Closed on
Nov 15, 2023
Sold by
Estate Of Joseph Sparta and Kelly J. Goldberg Executor
Bought by
Paul Shagar Kumar
Current Estimated Value
Home Financials for this Owner
Home Financials are based on the most recent Mortgage that was taken out on this home.
Original Mortgage
$816,000
Outstanding Balance
$800,342
Interest Rate
7.49%
Mortgage Type
Purchase Money Mortgage
Estimated Equity
$206,394
Purchase Details
Closed on
Oct 15, 2019
Sold by
Talt-Cerveny Maryann
Bought by
Sparta Joseph
Purchase Details
Closed on
Feb 27, 2016
Sold by
Sparta As Co-Guardian Joseph and Sparta Sparta
Bought by
Sparta Joseph and Talt-Cerveny Maryann
Create a Home Valuation Report for This Property
The Home Valuation Report is an in-depth analysis detailing your home's value as well as a comparison with similar homes in the area
Home Values in the Area
Average Home Value in this Area
Purchase History
| Date | Buyer | Sale Price | Title Company |
|---|---|---|---|
| Paul Shagar Kumar | $960,000 | -- | |
| Paul Shagar Kumar | $960,000 | -- | |
| Sparta Joseph | $375,000 | -- | |
| Sparta Joseph | $375,000 | -- | |
| Sparta Joseph | -- | -- | |
| Sparta Joseph | -- | -- |
Source: Public Records
Mortgage History
| Date | Status | Borrower | Loan Amount |
|---|---|---|---|
| Open | Paul Shagar Kumar | $816,000 | |
| Closed | Paul Shagar Kumar | $816,000 |
Source: Public Records
Tax History
| Year | Tax Paid | Tax Assessment Tax Assessment Total Assessment is a certain percentage of the fair market value that is determined by local assessors to be the total taxable value of land and additions on the property. | Land | Improvement |
|---|---|---|---|---|
| 2025 | $7,628 | $40,255 | $7,836 | $32,419 |
| 2024 | $7,628 | $37,978 | $8,435 | $29,543 |
| 2023 | $7,197 | $35,831 | $7,698 | $28,133 |
| 2022 | $7,153 | $54,480 | $11,820 | $42,660 |
| 2021 | $7,483 | $53,640 | $11,820 | $41,820 |
| 2020 | $7,101 | $51,060 | $11,820 | $39,240 |
| 2019 | $6,328 | $51,300 | $11,820 | $39,480 |
| 2018 | $5,789 | $29,859 | $7,770 | $22,089 |
| 2017 | $5,787 | $29,859 | $8,500 | $21,359 |
| 2016 | $5,030 | $29,859 | $8,500 | $21,359 |
| 2015 | $1,017 | $27,955 | $9,581 | $18,374 |
| 2014 | $1,017 | $26,374 | $9,993 | $16,381 |
Source: Public Records
Map
Nearby Homes
- 61-06 60th Dr
- 60-58 60th Rd
- 5974 Fresh Pond Rd
- 60-23 61st St
- 62-18 60th Dr
- 60-28 60th Place
- 60-14 60th Ave
- 62-63 60th Dr
- 5911 Fresh Pond Rd
- 6161 62nd Ave
- 60-66 60th St
- 58-29 60th Ln
- 64-41 60th Ave
- 61-24 65th St
- 58-22 60th Place
- 61-05 65th St
- 56-18 62nd Ave
- 5803 Metropolitan Ave
- 6167 56th St
- 5917 59th Dr
Your Personal Tour Guide
Ask me questions while you tour the home.