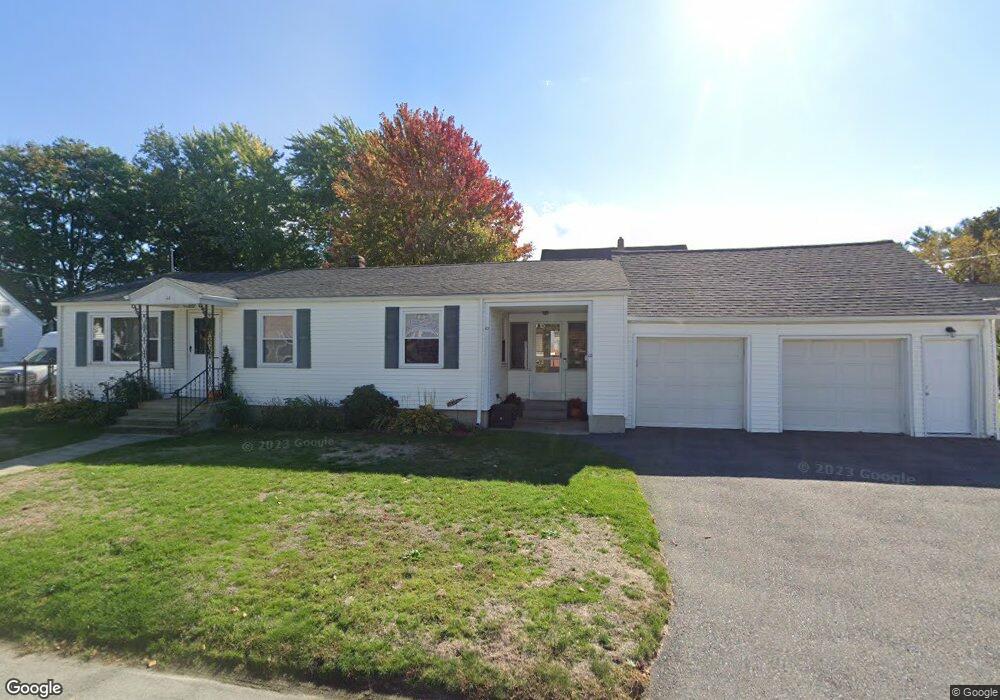
60 Allen Ave Cranston, RI 02910
Eden Park NeighborhoodEstimated Value: $372,000 - $383,044
3
Beds
1
Bath
2,080
Sq Ft
$181/Sq Ft
Est. Value
About This Home
This home is located at 60 Allen Ave, Cranston, RI 02910 and is currently estimated at $377,511, approximately $181 per square foot. 60 Allen Ave is a home located in Providence County with nearby schools including Daniel D. Waterman School, Park View Middle School, and Cranston High School East.
Ownership History
Date
Name
Owned For
Owner Type
Purchase Details
Closed on
Sep 10, 2007
Sold by
Pashos George
Bought by
Cower Bonnie and Cower Edward
Current Estimated Value
Purchase Details
Closed on
Jan 13, 2006
Sold by
Rathbun Elizabeth
Bought by
Pashos George
Purchase Details
Closed on
Jul 22, 1996
Sold by
Almeida Alcino G and Coccio Mary S
Bought by
Rathbun Robert H
Create a Home Valuation Report for This Property
The Home Valuation Report is an in-depth analysis detailing your home's value as well as a comparison with similar homes in the area
Home Values in the Area
Average Home Value in this Area
Purchase History
| Date | Buyer | Sale Price | Title Company |
|---|---|---|---|
| Cower Bonnie | $211,000 | -- | |
| Pashos George | $240,000 | -- | |
| Rathbun Robert H | $84,000 | -- |
Source: Public Records
Mortgage History
| Date | Status | Borrower | Loan Amount |
|---|---|---|---|
| Open | Rathbun Robert H | $22,109 | |
| Open | Rathbun Robert H | $241,842 | |
| Closed | Rathbun Robert H | $217,200 |
Source: Public Records
Tax History Compared to Growth
Tax History
| Year | Tax Paid | Tax Assessment Tax Assessment Total Assessment is a certain percentage of the fair market value that is determined by local assessors to be the total taxable value of land and additions on the property. | Land | Improvement |
|---|---|---|---|---|
| 2025 | $4,335 | $312,300 | $110,400 | $201,900 |
| 2024 | $4,250 | $312,300 | $110,400 | $201,900 |
| 2023 | $4,164 | $220,300 | $72,700 | $147,600 |
| 2022 | $4,078 | $220,300 | $72,700 | $147,600 |
| 2021 | $3,965 | $220,300 | $72,700 | $147,600 |
| 2020 | $3,753 | $180,700 | $69,200 | $111,500 |
| 2019 | $3,753 | $180,700 | $69,200 | $111,500 |
| 2018 | $3,666 | $180,700 | $69,200 | $111,500 |
| 2017 | $3,590 | $156,500 | $62,300 | $94,200 |
| 2016 | $3,381 | $150,600 | $62,300 | $88,300 |
| 2015 | $3,381 | $150,600 | $62,300 | $88,300 |
| 2014 | $3,288 | $151,800 | $62,300 | $89,500 |
Source: Public Records
Map
Nearby Homes
- 81 Allen Ave
- 15 Spruce Ave
- 150 Riverside Ave
- 10 Woburn St
- 105 Broadmoor Rd
- 638 Pontiac Ave
- 26 Keith Ave
- 120 Gould Ave
- 110 Heath Ave
- 35 Manson Ave
- 18 Glenwood Ave
- 105 Fordson Ave
- 85 Alton St
- 113 Fordson Ave
- 65 Perkins Ave
- 35 Welfare Ave
- 70 Perkins Ave
- 124 Clarence St
- 132 Fordson Ave Unit 12
- 36 Blackamore Ave