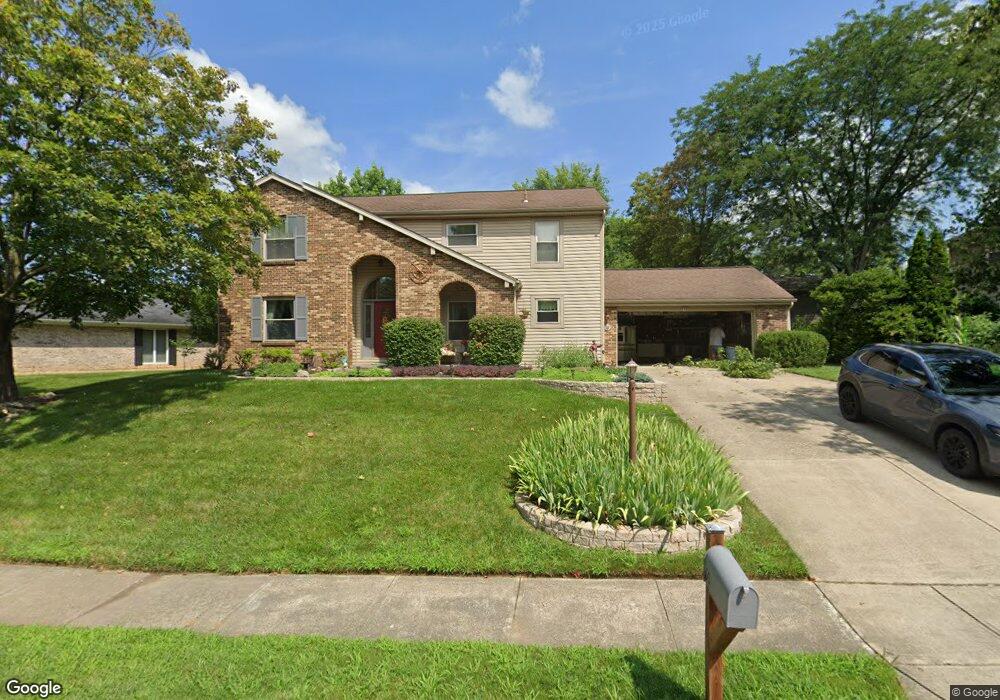
60 Bayberry Dr Springboro, OH 45066
Estimated Value: $344,000 - $380,000
4
Beds
3
Baths
2,296
Sq Ft
$156/Sq Ft
Est. Value
About This Home
This home is located at 60 Bayberry Dr, Springboro, OH 45066 and is currently estimated at $357,275, approximately $155 per square foot. 60 Bayberry Dr is a home located in Warren County with nearby schools including Clearcreek Elementary School, Springboro Intermediate School, and Dennis Elementary School.
Ownership History
Date
Name
Owned For
Owner Type
Purchase Details
Closed on
Oct 17, 1997
Sold by
Pfeiffer John C
Bought by
Belter Anthony J and Belter R
Current Estimated Value
Home Financials for this Owner
Home Financials are based on the most recent Mortgage that was taken out on this home.
Original Mortgage
$120,600
Outstanding Balance
$16,768
Interest Rate
7.65%
Mortgage Type
New Conventional
Estimated Equity
$340,507
Purchase Details
Closed on
Jun 14, 1995
Sold by
Bockelman Joseph H
Bought by
Pfeiffer John C
Purchase Details
Closed on
Sep 25, 1989
Sold by
Ragon Wm. T and Ragon Deborah L
Bought by
Bockelman and Bockelman Joseph H
Purchase Details
Closed on
Aug 13, 1986
Sold by
Zaronas Richard L and Zaronas Ela
Bought by
Ragon and Ragon Wm T
Purchase Details
Closed on
May 1, 1984
Sold by
Shinlever Tomie G and Shinlever Eth
Bought by
Zaronas and Zaronas Richard L
Purchase Details
Closed on
Nov 23, 1981
Sold by
Gem City Savings Assoc
Purchase Details
Closed on
Aug 29, 1980
Sold by
Webb Webb and Webb Burlin
Purchase Details
Closed on
Jun 12, 1978
Sold by
Tri Ohio Develoment Co
Purchase Details
Closed on
Mar 17, 1978
Sold by
Tri-Ohio Dev Co
Create a Home Valuation Report for This Property
The Home Valuation Report is an in-depth analysis detailing your home's value as well as a comparison with similar homes in the area
Home Values in the Area
Average Home Value in this Area
Purchase History
| Date | Buyer | Sale Price | Title Company |
|---|---|---|---|
| Belter Anthony J | $134,000 | -- | |
| Pfeiffer John C | $131,500 | -- | |
| Bockelman | $112,500 | -- | |
| Ragon | $93,000 | -- | |
| Zaronas | $85,500 | -- | |
| -- | $82,900 | -- | |
| -- | $46,700 | -- | |
| -- | $29,500 | -- | |
| -- | -- | -- |
Source: Public Records
Mortgage History
| Date | Status | Borrower | Loan Amount |
|---|---|---|---|
| Open | Belter Anthony J | $120,600 | |
| Closed | Pfeiffer John C | -- |
Source: Public Records
Tax History
| Year | Tax Paid | Tax Assessment Tax Assessment Total Assessment is a certain percentage of the fair market value that is determined by local assessors to be the total taxable value of land and additions on the property. | Land | Improvement |
|---|---|---|---|---|
| 2025 | $3,338 | $85,480 | $24,500 | $60,980 |
| 2024 | $3,338 | $85,480 | $24,500 | $60,980 |
| 2023 | $2,917 | $68,509 | $16,520 | $51,989 |
| 2022 | $2,874 | $68,509 | $16,520 | $51,989 |
| 2021 | $2,675 | $68,509 | $16,520 | $51,989 |
| 2020 | $2,593 | $58,058 | $14,000 | $44,058 |
| 2019 | $2,391 | $58,058 | $14,000 | $44,058 |
| 2018 | $2,393 | $58,058 | $14,000 | $44,058 |
| 2017 | $2,261 | $49,417 | $12,096 | $37,321 |
| 2016 | $2,358 | $49,417 | $12,096 | $37,321 |
| 2015 | $2,331 | $49,417 | $12,096 | $37,321 |
| 2014 | $2,331 | $46,180 | $11,310 | $34,880 |
| 2013 | $2,330 | $57,190 | $14,000 | $43,190 |
Source: Public Records
Map
Nearby Homes
- 225 Renwood Place
- 245 Whispering Pines St
- 35 Edgebrooke Dr
- 4 Chestnut St
- 72 Pebble Brook Place
- 10 Woods Rd
- 23 Pheasant Run Cir Unit 9A
- 45 Wadestone St
- 40 Libby Hollow St
- 340 Saint James Place
- 90 Libby Hollow St
- 140 Dan Haven Place
- 15 Wadestone Ln
- 350 Spruceway Dr
- 65 Ed Knoll Bend
- 80 Elkins Ln
- 70 Eleanor Dr
- 105 Cherry St
- 20 Terradyne Trace
- 84 W Mill St
- 40 Bayberry Dr
- 15 Southridge Ct
- 70 Bayberry Dr
- 20 Bayberry Dr
- 65 Bayberry Dr
- 55 Bayberry Dr
- 75 Bayberry Dr
- 25 Southridge Ct
- 45 Bayberry Dr
- 80 Springwood Dr
- 85 Bayberry Dr
- 35 Bayberry Dr
- 90 Springwood Dr
- 70 Springwood Dr
- 100 Bayberry Dr
- 25 Bayberry Dr
- 95 Bayberry Dr
- 100 Springwood Dr
- 35 Southridge Ct
- 20 Southridge Ct
Your Personal Tour Guide
Ask me questions while you tour the home.