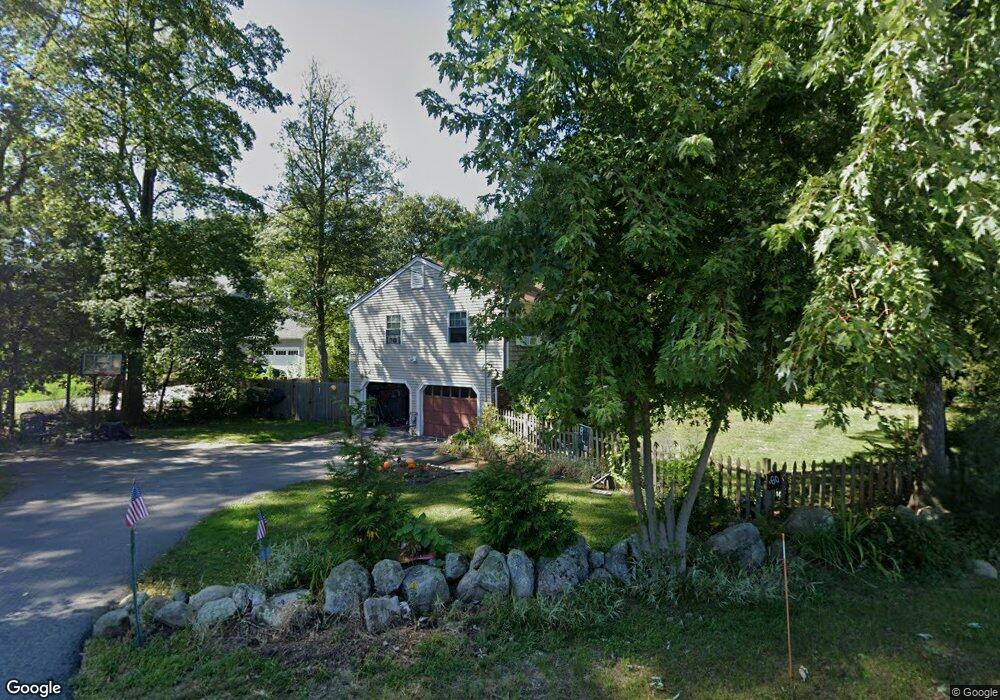
60 Bridge St Millis, MA 02054
Estimated Value: $549,000 - $582,000
3
Beds
2
Baths
2,620
Sq Ft
$217/Sq Ft
Est. Value
About This Home
This home is located at 60 Bridge St, Millis, MA 02054 and is currently estimated at $567,983, approximately $216 per square foot. 60 Bridge St is a home located in Norfolk County with nearby schools including Clyde F Brown, Millis Middle School, and Millis High School.
Ownership History
Date
Name
Owned For
Owner Type
Purchase Details
Closed on
Sep 17, 2024
Sold by
Calo Mary and Tufts Megan
Bought by
Calo Mary K
Current Estimated Value
Home Financials for this Owner
Home Financials are based on the most recent Mortgage that was taken out on this home.
Original Mortgage
$162,000
Outstanding Balance
$159,545
Interest Rate
6.47%
Mortgage Type
New Conventional
Estimated Equity
$408,438
Purchase Details
Closed on
Oct 15, 2012
Sold by
Calo Joseph A and Calo Gay K
Bought by
Calo Mary and Tufts Megan
Purchase Details
Closed on
Oct 3, 2012
Sold by
Calo Joseph A
Bought by
Calo Joseph A and Calo Gay K
Purchase Details
Closed on
Dec 3, 2010
Sold by
Cubbon Douglas K and Dearden Peter E
Bought by
Calo Joseph A
Create a Home Valuation Report for This Property
The Home Valuation Report is an in-depth analysis detailing your home's value as well as a comparison with similar homes in the area
Home Values in the Area
Average Home Value in this Area
Purchase History
| Date | Buyer | Sale Price | Title Company |
|---|---|---|---|
| Calo Mary K | -- | None Available | |
| Calo Mary K | -- | None Available | |
| Calo Mary | $275,000 | -- | |
| Calo Mary | $275,000 | -- | |
| Calo Joseph A | -- | -- | |
| Calo Joseph A | $246,200 | -- | |
| Calo Mary | $275,000 | -- | |
| Calo Joseph A | -- | -- | |
| Calo Joseph A | $246,200 | -- |
Source: Public Records
Mortgage History
| Date | Status | Borrower | Loan Amount |
|---|---|---|---|
| Open | Calo Mary K | $162,000 | |
| Closed | Calo Mary K | $162,000 | |
| Closed | Calo Joseph A | $0 |
Source: Public Records
Tax History
| Year | Tax Paid | Tax Assessment Tax Assessment Total Assessment is a certain percentage of the fair market value that is determined by local assessors to be the total taxable value of land and additions on the property. | Land | Improvement |
|---|---|---|---|---|
| 2025 | $7,933 | $483,700 | $187,600 | $296,100 |
| 2024 | $7,599 | $462,800 | $187,600 | $275,200 |
| 2023 | $7,459 | $426,500 | $163,200 | $263,300 |
| 2022 | $7,212 | $382,000 | $163,200 | $218,800 |
| 2021 | $7,155 | $364,700 | $163,200 | $201,500 |
| 2020 | $6,854 | $340,300 | $152,500 | $187,800 |
| 2019 | $6,195 | $331,300 | $143,500 | $187,800 |
| 2018 | $5,736 | $318,300 | $130,500 | $187,800 |
| 2017 | $5,640 | $306,200 | $135,000 | $171,200 |
| 2016 | $5,340 | $306,200 | $135,000 | $171,200 |
| 2015 | $5,205 | $306,200 | $135,000 | $171,200 |
Source: Public Records
Map
Nearby Homes
- 29 Bridge St
- 55 West St Unit 3
- 2 Lincoln Ct
- 11 Parnell St
- 64 Village St
- 6 Rivendell Ln
- 16 Laurel Dr
- 20 Hemlock Cir
- 6 Beech St
- 25 Bayberry Cir Unit 25
- 324 Union St Unit 1
- 5 Castle Ave
- 42 Maple Ln
- 6 Rosenfeld Rd
- 28 Key St Unit 28
- 26 Maple Ln Unit 26
- 216 Plain St
- 80 Pleasant St
- 82 Pleasant St
- 22 Sunset Way Unit 22
Your Personal Tour Guide
Ask me questions while you tour the home.