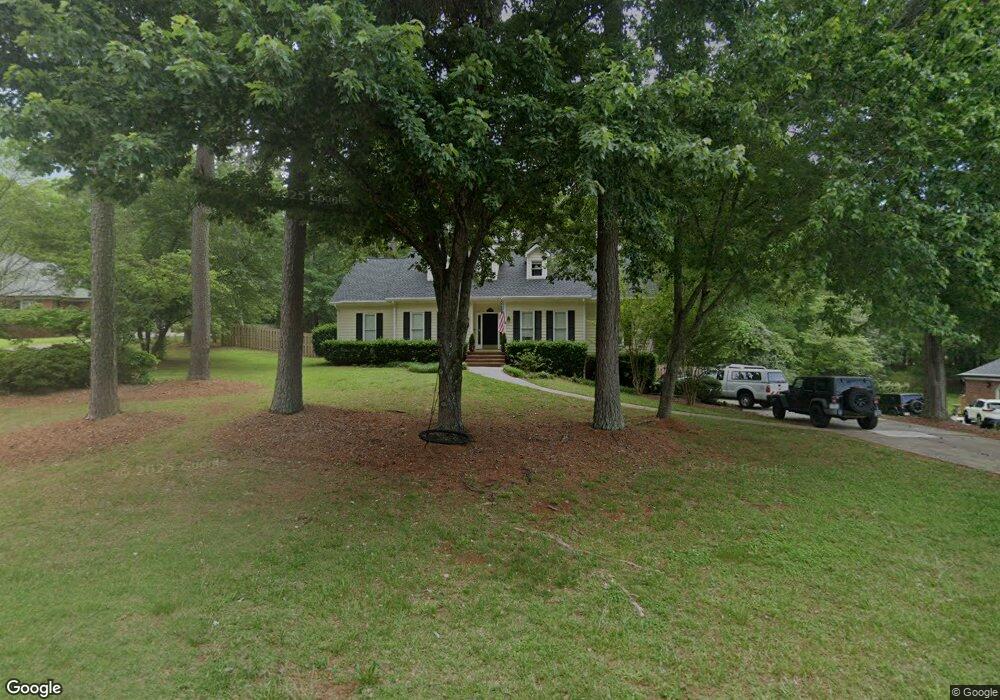
60 Cannongate Trace Sharpsburg, GA 30277
Estimated Value: $474,000 - $534,000
4
Beds
3
Baths
3,302
Sq Ft
$152/Sq Ft
Est. Value
About This Home
This home is located at 60 Cannongate Trace, Sharpsburg, GA 30277 and is currently estimated at $502,528, approximately $152 per square foot. 60 Cannongate Trace is a home located in Coweta County with nearby schools including Canongate Elementary School, Madras Middle School, and Northgate High School.
Ownership History
Date
Name
Owned For
Owner Type
Purchase Details
Closed on
Sep 26, 2023
Sold by
Roof Bettie J
Bought by
Williams Kenneth
Current Estimated Value
Purchase Details
Closed on
Jun 11, 2021
Sold by
Queen Matthew J
Bought by
Williams Kenneth and Williams Andrea
Home Financials for this Owner
Home Financials are based on the most recent Mortgage that was taken out on this home.
Original Mortgage
$235,000
Interest Rate
2.9%
Mortgage Type
New Conventional
Purchase Details
Closed on
Apr 27, 2012
Sold by
Gunning Sheryl Anne
Bought by
Queen Matthew J and Queen Kelley E
Home Financials for this Owner
Home Financials are based on the most recent Mortgage that was taken out on this home.
Original Mortgage
$184,103
Interest Rate
3.75%
Mortgage Type
FHA
Purchase Details
Closed on
Sep 30, 2010
Sold by
Hatfield Frances L
Bought by
Hatfield Theodore R
Purchase Details
Closed on
Jan 31, 1988
Bought by
Hatfield Frances L
Create a Home Valuation Report for This Property
The Home Valuation Report is an in-depth analysis detailing your home's value as well as a comparison with similar homes in the area
Home Values in the Area
Average Home Value in this Area
Purchase History
| Date | Buyer | Sale Price | Title Company |
|---|---|---|---|
| Williams Kenneth | -- | -- | |
| Williams Kenneth | $385,000 | -- | |
| Queen Matthew J | $187,500 | -- | |
| Hatfield Theodore R | -- | -- | |
| Hatfield Frances L | $131,500 | -- |
Source: Public Records
Mortgage History
| Date | Status | Borrower | Loan Amount |
|---|---|---|---|
| Previous Owner | Williams Kenneth | $235,000 | |
| Previous Owner | Queen Matthew J | $184,103 |
Source: Public Records
Tax History Compared to Growth
Tax History
| Year | Tax Paid | Tax Assessment Tax Assessment Total Assessment is a certain percentage of the fair market value that is determined by local assessors to be the total taxable value of land and additions on the property. | Land | Improvement |
|---|---|---|---|---|
| 2025 | $4,569 | $193,402 | $32,000 | $161,402 |
| 2024 | $3,908 | $168,327 | $32,000 | $136,327 |
| 2023 | $3,908 | $168,317 | $28,000 | $140,317 |
| 2022 | $3,794 | $154,134 | $28,000 | $126,134 |
| 2021 | $3,541 | $139,180 | $20,000 | $119,180 |
| 2020 | $3,563 | $139,180 | $20,000 | $119,180 |
| 2019 | $2,723 | $97,825 | $20,000 | $77,825 |
| 2018 | $2,868 | $97,825 | $20,000 | $77,825 |
| 2017 | $2,726 | $93,004 | $20,000 | $73,004 |
| 2016 | $2,653 | $91,626 | $20,000 | $71,626 |
| 2015 | $2,609 | $91,626 | $20,000 | $71,626 |
| 2014 | $2,118 | $75,428 | $10,000 | $65,428 |
Source: Public Records
Map
Nearby Homes
- 35 Palmer Place
- 56 Hudgen Rd
- 518 Palmetto Tyrone Rd
- 291 Cannongate Rd
- 9 Warrior Way
- 40 Joe Lee Dr
- 0 Fischer Spur Rd Unit 10495301
- 30 Joe Lee Dr
- 27 Dorian Ct
- 32 Riverbirch Way
- 78 Rosebay Ln
- 20 Skipton Ct
- 50 Big Oaks Ct
- 70 N Strathmore Dr
- 40 Wenham Ln
- 10 Monteray Ct
- 127 Northgate Preserve Dr
- 46 I W Brooks Rd
- 2460 N Highway 29 Unit 2
- 5588 Highway 29 N
- 50 Cannongate Trace
- 70 Cannongate Trace
- 700 Palmetto Tyrone Rd
- 15 Nelson Nook Unit 1
- 40 Cannongate Trace
- 40 Cannongate Trace Unit A-9
- 20 Nelson Nook
- 80 Cannongate Trace Unit A5
- 80 Cannongate Trace
- 15 Bobby Jones Cir
- 75 Cannongate Trace
- 30 Cannongate Trace
- 698 Palmetto Tyrone Rd
- 0 Bobby Jones Cir
- 45 Cannongate Trace
- 81 Cannongate Rd
- 90 Cannongate Trace
- 25 Cannongate Trace
- 55 Cannongate Rd Unit 9-B
- 55 Cannongate Rd