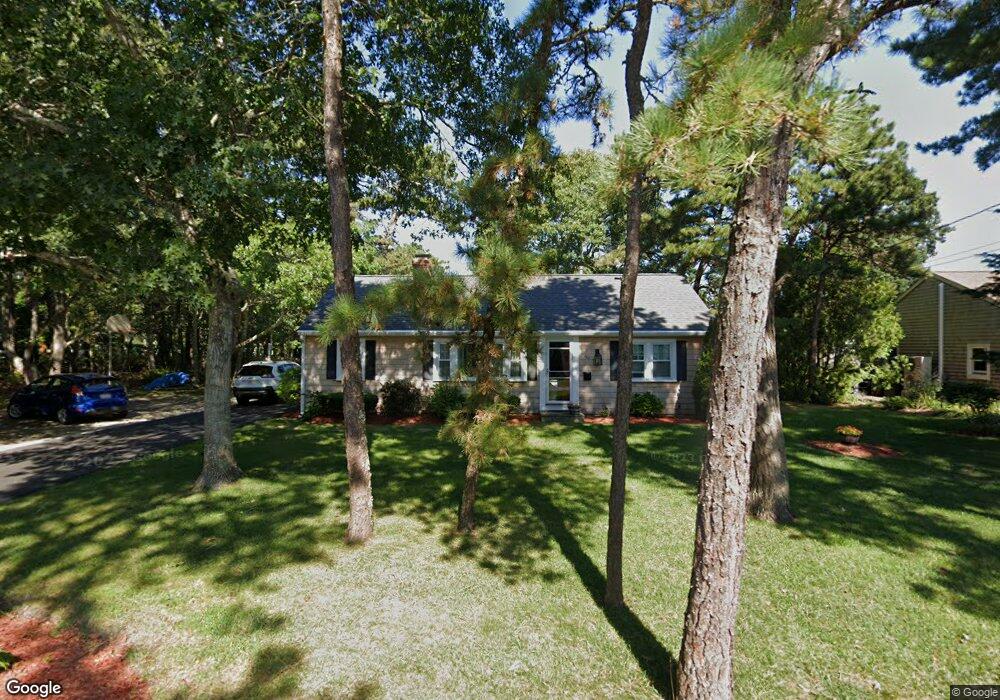
60 Cedar St South Yarmouth, MA 02664
Estimated Value: $474,000 - $574,000
3
Beds
1
Bath
1,001
Sq Ft
$538/Sq Ft
Est. Value
About This Home
This home is located at 60 Cedar St, South Yarmouth, MA 02664 and is currently estimated at $538,464, approximately $537 per square foot. 60 Cedar St is a home located in Barnstable County with nearby schools including Dennis-Yarmouth Regional High School and St. Pius X. School.
Ownership History
Date
Name
Owned For
Owner Type
Purchase Details
Closed on
Aug 28, 2012
Sold by
Ingram George A and Ingram Rosemary
Bought by
Ingram George A and Ingram Rosemary
Current Estimated Value
Purchase Details
Closed on
Oct 1, 1999
Sold by
Bovenzi John F and Bovenzi Barbara B
Bought by
Ingram George and Ingram Rosemary
Home Financials for this Owner
Home Financials are based on the most recent Mortgage that was taken out on this home.
Original Mortgage
$43,000
Interest Rate
7.85%
Mortgage Type
Purchase Money Mortgage
Create a Home Valuation Report for This Property
The Home Valuation Report is an in-depth analysis detailing your home's value as well as a comparison with similar homes in the area
Home Values in the Area
Average Home Value in this Area
Purchase History
| Date | Buyer | Sale Price | Title Company |
|---|---|---|---|
| Ingram George A | -- | -- | |
| Ingram George | $137,900 | -- |
Source: Public Records
Mortgage History
| Date | Status | Borrower | Loan Amount |
|---|---|---|---|
| Previous Owner | Ingram George | $43,000 |
Source: Public Records
Tax History Compared to Growth
Tax History
| Year | Tax Paid | Tax Assessment Tax Assessment Total Assessment is a certain percentage of the fair market value that is determined by local assessors to be the total taxable value of land and additions on the property. | Land | Improvement |
|---|---|---|---|---|
| 2025 | $3,136 | $442,900 | $222,800 | $220,100 |
| 2024 | $2,922 | $395,900 | $193,800 | $202,100 |
| 2023 | $2,777 | $342,400 | $163,600 | $178,800 |
| 2022 | $2,648 | $288,400 | $146,400 | $142,000 |
| 2021 | $2,547 | $266,400 | $146,400 | $120,000 |
| 2020 | $2,509 | $250,900 | $144,100 | $106,800 |
| 2019 | $2,375 | $235,100 | $144,100 | $91,000 |
| 2018 | $2,332 | $226,600 | $135,600 | $91,000 |
| 2017 | $2,271 | $226,600 | $135,600 | $91,000 |
| 2016 | $2,261 | $226,600 | $135,600 | $91,000 |
| 2015 | $1,681 | $167,400 | $87,300 | $80,100 |
Source: Public Records
Map
Nearby Homes
- 9 Cedar St
- 4 Braddock St
- 8 Holly Ln
- 27 Wilfin Rd
- 8 Rogers Ave
- 31 Gardiner Ln
- 16 Peregrine Ln
- 844 Route 28 Unit 1C
- 844 Route 28 Unit 1C
- 844 Route 28 Unit 9B
- 26 Howes Rd
- 21 Lyndale Rd
- 745 Willow St
- 7 Wood Rd
- 55 Aspinet Rd
- 55 Pawkannawkut Dr
- 109 Seaview Ave Unit 11
- 68 Bob-O-link Ln
- 3 Saturn Ln
- 17 Merganser Ln