Estimated Value: $775,002 - $893,000
4
Beds
2
Baths
2,088
Sq Ft
$396/Sq Ft
Est. Value
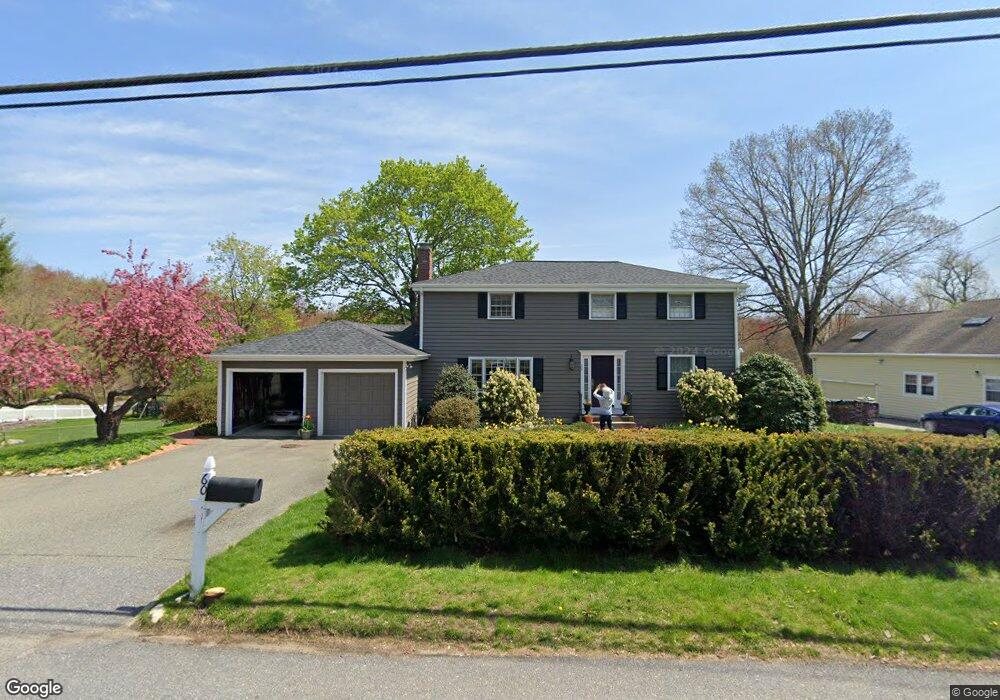
About This Home
This home is located at 60 Conant St, Acton, MA 01720 and is currently estimated at $827,501, approximately $396 per square foot. 60 Conant St is a home located in Middlesex County with nearby schools including Acton-Boxborough Regional High School, Maynard Knowledge Beginnings, and The Imago School.
Ownership History
Date
Name
Owned For
Owner Type
Purchase Details
Closed on
Jul 28, 1993
Sold by
Gothorpe William G and Gothorpe Mary J
Bought by
Touroyan Agop J and Jette Carol E
Current Estimated Value
Home Financials for this Owner
Home Financials are based on the most recent Mortgage that was taken out on this home.
Original Mortgage
$145,000
Interest Rate
7.32%
Mortgage Type
Purchase Money Mortgage
Create a Home Valuation Report for This Property
The Home Valuation Report is an in-depth analysis detailing your home's value as well as a comparison with similar homes in the area
Home Values in the Area
Average Home Value in this Area
Purchase History
| Date | Buyer | Sale Price | Title Company |
|---|---|---|---|
| Touroyan Agop J | $254,000 | -- |
Source: Public Records
Mortgage History
| Date | Status | Borrower | Loan Amount |
|---|---|---|---|
| Closed | Touroyan Agop J | $145,000 | |
| Previous Owner | Touroyan Agop J | $50,000 | |
| Previous Owner | Touroyan Agop J | $25,000 |
Source: Public Records
Tax History
| Year | Tax Paid | Tax Assessment Tax Assessment Total Assessment is a certain percentage of the fair market value that is determined by local assessors to be the total taxable value of land and additions on the property. | Land | Improvement |
|---|---|---|---|---|
| 2025 | $11,719 | $683,300 | $317,300 | $366,000 |
| 2024 | $11,191 | $671,300 | $317,300 | $354,000 |
| 2023 | $10,891 | $620,200 | $288,400 | $331,800 |
| 2022 | $10,320 | $530,600 | $250,800 | $279,800 |
| 2021 | $10,056 | $497,100 | $232,100 | $265,000 |
| 2020 | $9,493 | $493,400 | $232,100 | $261,300 |
| 2019 | $9,069 | $468,200 | $232,100 | $236,100 |
| 2018 | $9,072 | $468,100 | $232,100 | $236,000 |
| 2017 | $8,850 | $464,300 | $232,100 | $232,200 |
| 2016 | $8,705 | $452,700 | $232,100 | $220,600 |
| 2015 | $8,552 | $448,900 | $232,100 | $216,800 |
| 2014 | $8,321 | $427,800 | $232,100 | $195,700 |
Source: Public Records
Map
Nearby Homes
- 63 Conant St
- 2 Marble Farm Rd
- 12 Brown St
- 17 Prospect St
- 37 Glendale St
- 30 Brewster Ln
- 70 Powder Mill Rd
- 40 High St
- 68 Powder Mill Rd
- 66 Powder Mill Rd
- 2 & 6 Powder Mill Rd
- 71 Liberty St
- 131 Main St
- 70 River St
- 128 Parker St Unit 3B
- 129 Main St Unit 129
- 19 Railroad St Unit D2
- 19 Railroad St Unit C2
- 24 Deer Path Unit 5
- 28 Waltham St Unit A
Your Personal Tour Guide
Ask me questions while you tour the home.