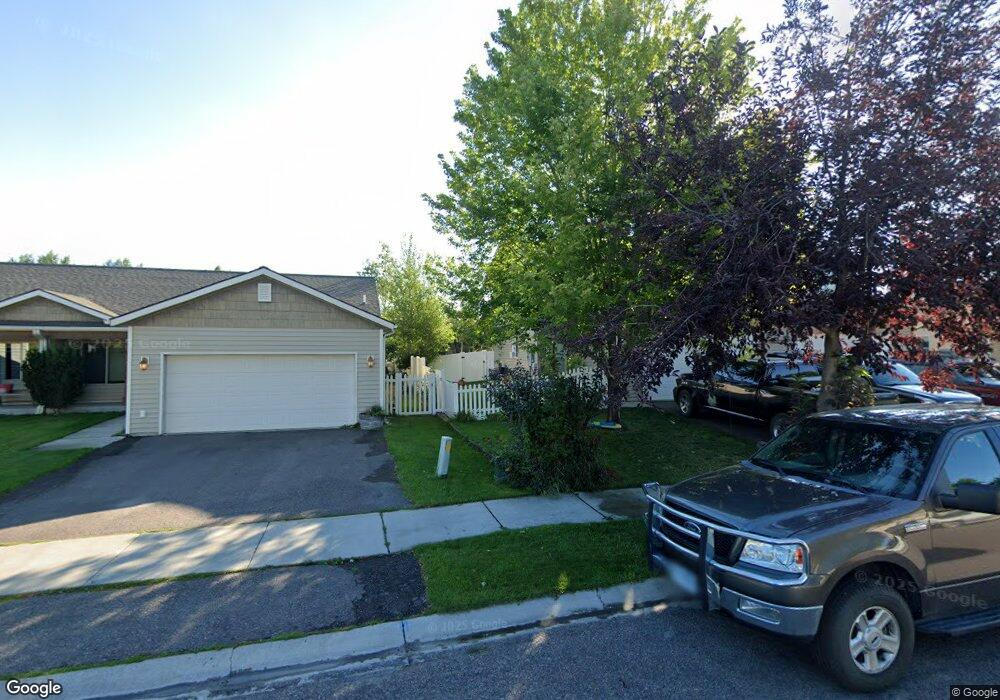
60 Empire Loop Kalispell, MT 59901
Estimated Value: $417,000 - $503,000
3
Beds
3
Baths
2,316
Sq Ft
$194/Sq Ft
Est. Value
About This Home
This home is located at 60 Empire Loop, Kalispell, MT 59901 and is currently estimated at $449,784, approximately $194 per square foot. 60 Empire Loop is a home located in Flathead County with nearby schools including Edgerton School, Kalispell Middle School, and Glacier High School.
Ownership History
Date
Name
Owned For
Owner Type
Purchase Details
Closed on
Apr 17, 2020
Sold by
Sobolik Melvin N and Sobolik Nancy A
Bought by
Fisher Property Management Llc
Current Estimated Value
Home Financials for this Owner
Home Financials are based on the most recent Mortgage that was taken out on this home.
Original Mortgage
$195,200
Outstanding Balance
$172,263
Interest Rate
3.2%
Mortgage Type
Future Advance Clause Open End Mortgage
Estimated Equity
$277,521
Purchase Details
Closed on
Aug 27, 2008
Sold by
Clark Montana Co Llc
Bought by
Sobolik Melvin N and Sobolik Nancy A
Home Financials for this Owner
Home Financials are based on the most recent Mortgage that was taken out on this home.
Original Mortgage
$60,000
Interest Rate
6.5%
Mortgage Type
New Conventional
Create a Home Valuation Report for This Property
The Home Valuation Report is an in-depth analysis detailing your home's value as well as a comparison with similar homes in the area
Purchase History
| Date | Buyer | Sale Price | Title Company |
|---|---|---|---|
| Fisher Property Management Llc | -- | Insured Titles | |
| Sobolik Melvin N | -- | Fidelity National Title Of F |
Source: Public Records
Mortgage History
| Date | Status | Borrower | Loan Amount |
|---|---|---|---|
| Open | Fisher Property Management Llc | $195,200 | |
| Previous Owner | Sobolik Melvin N | $60,000 |
Source: Public Records
Tax History
| Year | Tax Paid | Tax Assessment Tax Assessment Total Assessment is a certain percentage of the fair market value that is determined by local assessors to be the total taxable value of land and additions on the property. | Land | Improvement |
|---|---|---|---|---|
| 2025 | $2,400 | $468,600 | $0 | $0 |
| 2024 | $3,183 | $408,700 | $0 | $0 |
| 2023 | $3,369 | $408,700 | $0 | $0 |
| 2022 | $2,926 | $291,300 | $0 | $0 |
| 2021 | $3,134 | $291,300 | $0 | $0 |
| 2020 | $2,771 | $235,460 | $0 | $0 |
| 2019 | $1,704 | $235,460 | $0 | $0 |
| 2018 | $1,324 | $192,600 | $0 | $0 |
| 2017 | $1,017 | $192,600 | $0 | $0 |
| 2016 | $1,158 | $182,000 | $0 | $0 |
| 2015 | $1,157 | $182,000 | $0 | $0 |
| 2014 | $1,252 | $110,346 | $0 | $0 |
Source: Public Records
Map
Nearby Homes
- 63 Empire Loop
- 38 Vanderbilt Dr
- 90 Empire Loop
- 249 Three Mile Dr
- 17 Empire Loop
- 140 Barron Way
- 119 Barron Way
- 108 Hearst Dr
- 188 N Riding Rd
- 174 Empire Loop
- 28 Vista Loop
- 125 Sherry Ln
- 210 Kara Dr
- 240 Kara Dr
- 224 Kara Dr
- 287 Kara Dr
- 120 Garland St
- 507 Northridge Dr
- 106 Northern Lights Blvd
- 408 Needlegrass Ln
- 62 Empire Loop
- 58 Empire Loop
- 56 Empire Loop
- 66 Empire Loop
- 54 Empire Loop
- 65 Empire Loop
- 68 Empire Loop
- 67 Empire Loop
- 52 Empire Loop
- 61 Empire Loop
- 70 Empire Loop
- 55 Vanderbilt Dr
- 50 Empire Loop
- 42 Carnegie Dr
- 53 Vanderbilt Dr
- 71 Empire Loop
- 72 Empire Loop
- 48 Empire Loop
- 49 Vanderbilt Dr
- 40 Carnegie Dr
Your Personal Tour Guide
Ask me questions while you tour the home.