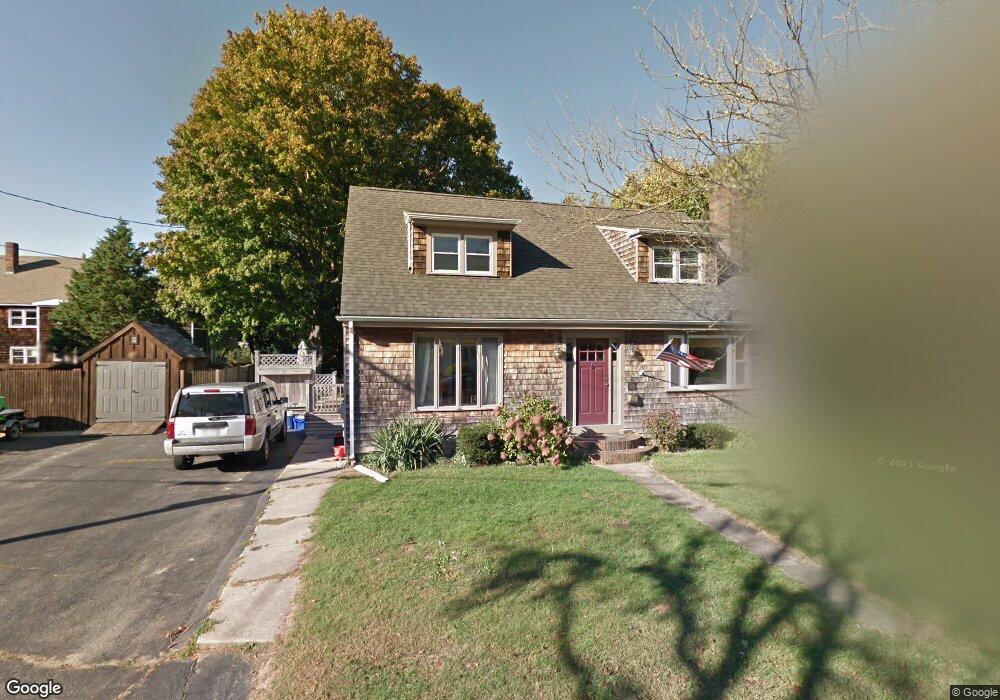
60 Farmfield St Fairhaven, MA 02719
Estimated Value: $628,855 - $764,000
5
Beds
2
Baths
1,981
Sq Ft
$343/Sq Ft
Est. Value
About This Home
This home is located at 60 Farmfield St, Fairhaven, MA 02719 and is currently estimated at $680,214, approximately $343 per square foot. 60 Farmfield St is a home located in Bristol County with nearby schools including Fairhaven High School, City On A Hill Charter Public School New Bedford, and St. Joseph School.
Ownership History
Date
Name
Owned For
Owner Type
Purchase Details
Closed on
Jun 15, 2018
Sold by
Tavares Scott M and Baldwin Amy J
Bought by
Carroll Erich C and Carroll Jill K
Current Estimated Value
Home Financials for this Owner
Home Financials are based on the most recent Mortgage that was taken out on this home.
Original Mortgage
$305,000
Outstanding Balance
$260,972
Interest Rate
4.5%
Mortgage Type
New Conventional
Estimated Equity
$419,242
Create a Home Valuation Report for This Property
The Home Valuation Report is an in-depth analysis detailing your home's value as well as a comparison with similar homes in the area
Home Values in the Area
Average Home Value in this Area
Purchase History
| Date | Buyer | Sale Price | Title Company |
|---|---|---|---|
| Carroll Erich C | -- | -- |
Source: Public Records
Mortgage History
| Date | Status | Borrower | Loan Amount |
|---|---|---|---|
| Open | Carroll Erich C | $305,000 |
Source: Public Records
Tax History
| Year | Tax Paid | Tax Assessment Tax Assessment Total Assessment is a certain percentage of the fair market value that is determined by local assessors to be the total taxable value of land and additions on the property. | Land | Improvement |
|---|---|---|---|---|
| 2025 | $46 | $498,800 | $180,800 | $318,000 |
| 2024 | $4,432 | $480,200 | $180,800 | $299,400 |
| 2023 | $4,158 | $417,900 | $167,600 | $250,300 |
| 2022 | $4,085 | $399,700 | $159,700 | $240,000 |
| 2021 | $3,952 | $350,000 | $145,200 | $204,800 |
| 2020 | $3,798 | $343,400 | $138,600 | $204,800 |
| 2019 | $3,046 | $261,000 | $126,200 | $134,800 |
| 2018 | $2,950 | $251,100 | $120,100 | $131,000 |
| 2017 | $2,920 | $242,500 | $120,100 | $122,400 |
| 2016 | $2,917 | $239,500 | $120,100 | $119,400 |
| 2015 | $2,731 | $224,800 | $120,100 | $104,700 |
Source: Public Records
Map
Nearby Homes
- 11 Lawton St
- 2 Washburn Ave
- 32 Cedar St
- 32 Green St
- 58 Washington St
- 24 Middle St
- 145 Pleasant St
- 0 Nulands Neck Unit 73286360
- 8 Washington St
- 8 Manor Dr
- 77 Adams St
- 39 Christian St
- 181 Washington St
- 67 Bridge St
- 58 Bayview Ave
- 27 Bayview Ave
- 15 Bayview Ave
- 138 Main St Unit 13
- 16 Ash St
- 15 School St
Your Personal Tour Guide
Ask me questions while you tour the home.