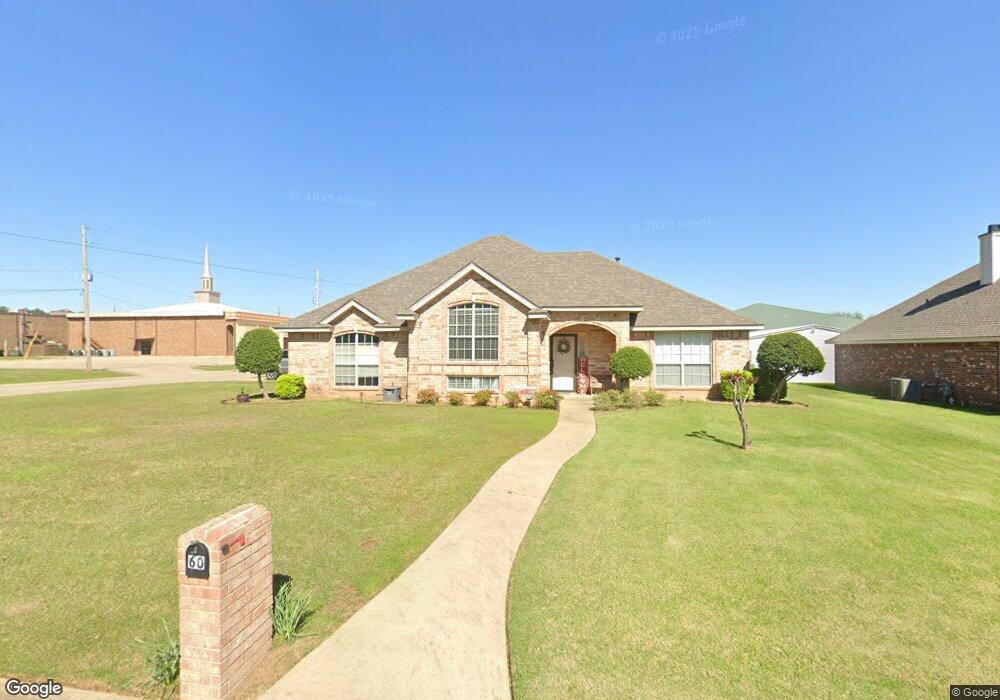
60 Fernwood Dr Texarkana, TX 75503
Estimated Value: $239,226 - $286,000
3
Beds
2
Baths
1,678
Sq Ft
$159/Sq Ft
Est. Value
About This Home
This home is located at 60 Fernwood Dr, Texarkana, TX 75503 and is currently estimated at $266,057, approximately $158 per square foot. 60 Fernwood Dr is a home located in Bowie County with nearby schools including Margaret Fischer Davis Elementary School, Pleasant Grove Intermediate School, and Pleasant Grove Middle School.
Ownership History
Date
Name
Owned For
Owner Type
Purchase Details
Closed on
Oct 17, 2016
Sold by
Tye Charles R and Tye Janice
Bought by
Deloach Gregory Lynn
Current Estimated Value
Home Financials for this Owner
Home Financials are based on the most recent Mortgage that was taken out on this home.
Original Mortgage
$128,000
Outstanding Balance
$60,088
Interest Rate
3.5%
Mortgage Type
New Conventional
Estimated Equity
$205,969
Purchase Details
Closed on
Dec 16, 2013
Sold by
Butler Steve V and Godwin Carol L
Bought by
Tye Charles R and Tye Janice
Create a Home Valuation Report for This Property
The Home Valuation Report is an in-depth analysis detailing your home's value as well as a comparison with similar homes in the area
Home Values in the Area
Average Home Value in this Area
Purchase History
| Date | Buyer | Sale Price | Title Company |
|---|---|---|---|
| Deloach Gregory Lynn | -- | Stewart Title | |
| Tye Charles R | -- | Stewart Title Of Texarkana |
Source: Public Records
Mortgage History
| Date | Status | Borrower | Loan Amount |
|---|---|---|---|
| Open | Deloach Gregory Lynn | $128,000 |
Source: Public Records
Tax History Compared to Growth
Tax History
| Year | Tax Paid | Tax Assessment Tax Assessment Total Assessment is a certain percentage of the fair market value that is determined by local assessors to be the total taxable value of land and additions on the property. | Land | Improvement |
|---|---|---|---|---|
| 2025 | $3,787 | $237,245 | $25,000 | $212,245 |
| 2024 | $3,787 | $226,206 | $25,000 | $204,395 |
| 2023 | $4,630 | $205,642 | $0 | $0 |
| 2022 | $4,590 | $202,683 | $25,000 | $177,683 |
| 2021 | $4,445 | $169,952 | $25,000 | $144,952 |
| 2020 | $4,336 | $164,937 | $25,000 | $139,937 |
| 2019 | $4,276 | $158,512 | $25,000 | $133,512 |
| 2018 | $4,006 | $149,353 | $24,000 | $125,353 |
| 2017 | $3,932 | $147,001 | $24,000 | $123,001 |
| 2016 | $3,932 | $147,001 | $24,000 | $123,001 |
| 2015 | $3,823 | $146,709 | $24,000 | $122,709 |
| 2014 | $3,823 | $142,199 | $24,000 | $118,199 |
Source: Public Records
Map
Nearby Homes