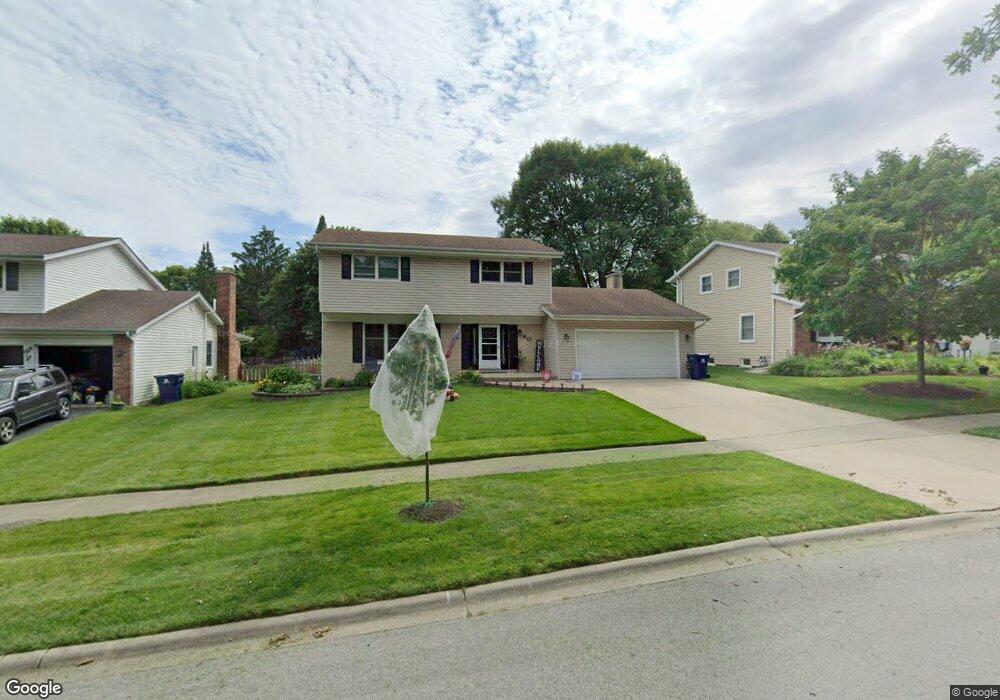
60 Finch Ct Naperville, IL 60565
Maple Brook NeighborhoodEstimated Value: $587,000 - $627,000
4
Beds
3
Baths
2,420
Sq Ft
$249/Sq Ft
Est. Value
About This Home
This home is located at 60 Finch Ct, Naperville, IL 60565 and is currently estimated at $602,911, approximately $249 per square foot. 60 Finch Ct is a home located in DuPage County with nearby schools including Maplebrook Elementary School, Lincoln Jr. High School, and Naperville Central High School.
Ownership History
Date
Name
Owned For
Owner Type
Purchase Details
Closed on
Sep 29, 2010
Sold by
Delnagro Phillip F and Delnagro Mary M
Bought by
Westphal James L and Westphal Julie A
Current Estimated Value
Home Financials for this Owner
Home Financials are based on the most recent Mortgage that was taken out on this home.
Original Mortgage
$295,650
Outstanding Balance
$194,202
Interest Rate
4.26%
Mortgage Type
New Conventional
Estimated Equity
$408,709
Create a Home Valuation Report for This Property
The Home Valuation Report is an in-depth analysis detailing your home's value as well as a comparison with similar homes in the area
Home Values in the Area
Average Home Value in this Area
Purchase History
| Date | Buyer | Sale Price | Title Company |
|---|---|---|---|
| Westphal James L | $328,500 | First American Title |
Source: Public Records
Mortgage History
| Date | Status | Borrower | Loan Amount |
|---|---|---|---|
| Open | Westphal James L | $295,650 |
Source: Public Records
Tax History Compared to Growth
Tax History
| Year | Tax Paid | Tax Assessment Tax Assessment Total Assessment is a certain percentage of the fair market value that is determined by local assessors to be the total taxable value of land and additions on the property. | Land | Improvement |
|---|---|---|---|---|
| 2024 | $8,912 | $153,474 | $74,343 | $79,131 |
| 2023 | $8,582 | $140,070 | $67,850 | $72,220 |
| 2022 | $8,245 | $133,400 | $64,620 | $68,780 |
| 2021 | $7,942 | $128,360 | $62,180 | $66,180 |
| 2020 | $7,772 | $126,050 | $61,060 | $64,990 |
| 2019 | $7,543 | $120,600 | $58,420 | $62,180 |
| 2018 | $7,351 | $117,650 | $56,990 | $60,660 |
| 2017 | $7,201 | $113,680 | $55,070 | $58,610 |
| 2016 | $7,054 | $109,570 | $53,080 | $56,490 |
| 2015 | $7,006 | $103,190 | $49,990 | $53,200 |
| 2014 | $6,869 | $98,280 | $47,610 | $50,670 |
| 2013 | $6,765 | $98,510 | $47,720 | $50,790 |
Source: Public Records
Map
Nearby Homes
- 1751 S Washington St Unit 1
- 1921 Wisteria Ct Unit 3
- 213 Winding Creek Dr
- 138 E Bailey Rd Unit M
- 128 E Bailey Rd Unit G
- 158 E Bailey Rd Unit F
- 303 Cedarbrook Rd
- 302 Carriage Hill Rd
- 47 Glencoe Ct Unit 102D
- 23 Glencoe Ct Unit 202B
- 2132 Berkley Ct Unit 201A
- 1443 Meander Dr
- 517 Sheffield Rd
- 1408 Swallow St
- 221 Hampshire Ct Unit 201D
- 621 Bourbon Ct
- 2167 Countryside Cir
- 336 Brooklea Ct
- 1967 Bristol Ct
- 2337 Worthing Dr Unit 102A