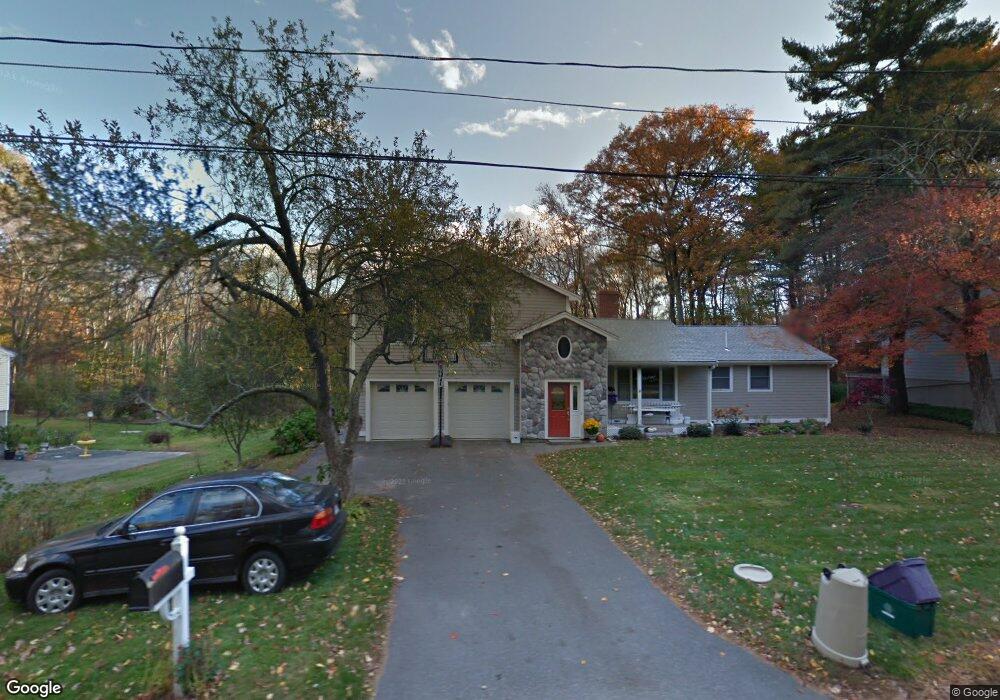
60 Hemlock Dr Holliston, MA 01746
Estimated Value: $782,000 - $857,000
4
Beds
3
Baths
2,370
Sq Ft
$341/Sq Ft
Est. Value
About This Home
This home is located at 60 Hemlock Dr, Holliston, MA 01746 and is currently estimated at $809,207, approximately $341 per square foot. 60 Hemlock Dr is a home located in Middlesex County with nearby schools including Placentino Elementary School, Miller Elementary School, and Robert H. Adams Middle School.
Ownership History
Date
Name
Owned For
Owner Type
Purchase Details
Closed on
Apr 22, 2025
Sold by
Dinehart Karen E and Dinehart Kirk R
Bought by
Dinehart Ft and Dinehart
Current Estimated Value
Purchase Details
Closed on
Jun 26, 1992
Sold by
Barbieri Peter R and Barbieri Diane M
Bought by
Dinehart Kirk R and Dinehart Karen E
Create a Home Valuation Report for This Property
The Home Valuation Report is an in-depth analysis detailing your home's value as well as a comparison with similar homes in the area
Home Values in the Area
Average Home Value in this Area
Purchase History
| Date | Buyer | Sale Price | Title Company |
|---|---|---|---|
| Dinehart Ft | -- | None Available | |
| Dinehart Ft | -- | None Available | |
| Dinehart Kirk R | $143,000 | -- | |
| Dinehart Kirk R | $143,000 | -- |
Source: Public Records
Mortgage History
| Date | Status | Borrower | Loan Amount |
|---|---|---|---|
| Previous Owner | Dinehart Kirk R | $159,300 | |
| Previous Owner | Dinehart Kirk R | $23,000 |
Source: Public Records
Tax History
| Year | Tax Paid | Tax Assessment Tax Assessment Total Assessment is a certain percentage of the fair market value that is determined by local assessors to be the total taxable value of land and additions on the property. | Land | Improvement |
|---|---|---|---|---|
| 2025 | $10,621 | $725,000 | $243,700 | $481,300 |
| 2024 | $9,310 | $618,200 | $243,700 | $374,500 |
| 2023 | $9,343 | $606,700 | $243,700 | $363,000 |
| 2022 | $8,401 | $483,400 | $243,700 | $239,700 |
| 2021 | $7,665 | $429,400 | $232,300 | $197,100 |
| 2020 | $8,111 | $430,300 | $209,700 | $220,600 |
| 2019 | $7,942 | $421,800 | $203,500 | $218,300 |
| 2018 | $7,875 | $421,800 | $203,500 | $218,300 |
| 2017 | $7,723 | $417,000 | $207,700 | $209,300 |
| 2016 | $7,343 | $390,800 | $178,400 | $212,400 |
| 2015 | $7,260 | $374,600 | $144,400 | $230,200 |
Source: Public Records
Map
Nearby Homes
- 48 Hemlock Dr
- 35 Peter St
- 50 Morgans Way
- 4 Bullard Cir
- 261 Rolling Meadow Dr
- 3 Thayer Rd
- 22 Greenview Dr
- 154 Union St
- 26 Mechanic St
- 3 Nobscott Rd
- 1366 Washington St
- 66 Lakeshore Dr
- 0 Hill St
- 26 Timber Crest Dr
- 40 Timber Crest Dr
- 25 Irving Place
- 19 Sycamore Way
- 17 Fairway Ln
- 11 Fairway Ln
- 731 Norfolk St
- 64 Hemlock Dr
- 63 Hemlock Dr
- 47 Hemlock Dr
- 72 Hemlock Dr
- 40 Hemlock Dr
- 82 Hemlock Dr
- 39 Hemlock Dr
- 79 Hemlock Dr
- 15 Evergreen Rd
- 18 Evergreen Rd
- 96 Hemlock Dr
- 32 Hemlock Dr
- 22 Spruce St
- 91 Hemlock Dr
- 31 Spruce St Unit 95
- 65 Spruce St Unit 112
- 69 Spruce St Unit 114
- 24 Hemlock Dr
- 17 Spruce St Unit 88
- 11 Spruce St
Your Personal Tour Guide
Ask me questions while you tour the home.