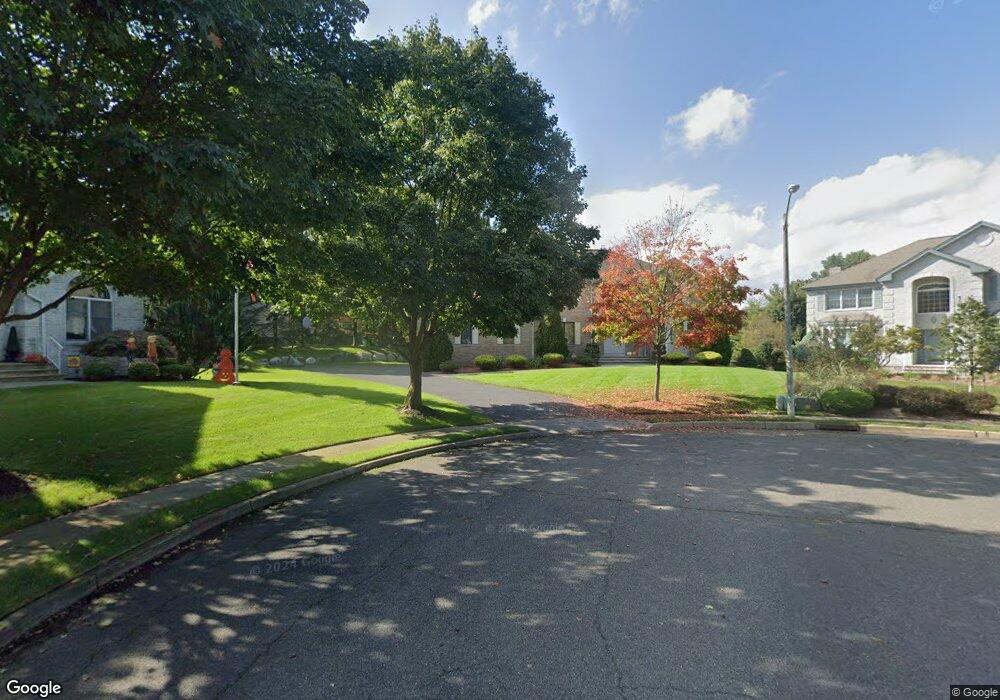
60 Hollybrook Rd Paramus, NJ 07652
Estimated Value: $1,378,000 - $1,586,000
4
Beds
4
Baths
3,714
Sq Ft
$408/Sq Ft
Est. Value
About This Home
This home is located at 60 Hollybrook Rd, Paramus, NJ 07652 and is currently estimated at $1,514,102, approximately $407 per square foot. 60 Hollybrook Rd is a home located in Bergen County with nearby schools including Paramus High School and Alpine Learning Group.
Ownership History
Date
Name
Owned For
Owner Type
Purchase Details
Closed on
May 1, 2021
Sold by
Lee Tom
Bought by
Lee Tom and Lee Joyce J
Current Estimated Value
Purchase Details
Closed on
Nov 4, 2019
Sold by
Chen Wen T
Bought by
Lee Tom
Purchase Details
Closed on
Jan 22, 2009
Sold by
Lyu Lil Hurng and Chen Wen Ting
Bought by
Chen Wen Ting
Purchase Details
Closed on
May 14, 1997
Sold by
Ray Saoud Farms Inc
Bought by
Lyu Lii Hurng and Chen Wen Ting
Home Financials for this Owner
Home Financials are based on the most recent Mortgage that was taken out on this home.
Original Mortgage
$200,000
Interest Rate
8.08%
Purchase Details
Closed on
Aug 1, 1995
Sold by
Cougar Const Corp
Bought by
Ray Saoud Farms Inc
Create a Home Valuation Report for This Property
The Home Valuation Report is an in-depth analysis detailing your home's value as well as a comparison with similar homes in the area
Home Values in the Area
Average Home Value in this Area
Purchase History
| Date | Buyer | Sale Price | Title Company |
|---|---|---|---|
| Lee Tom | -- | Westcor Land Title Ins Co | |
| Lee Tom | -- | Westcor Land Title | |
| Lee Tom | $895,000 | Westcore Title | |
| Chen Wen Ting | -- | -- | |
| Lyu Lii Hurng | $510,000 | -- | |
| Ray Saoud Farms Inc | $185,000 | -- |
Source: Public Records
Mortgage History
| Date | Status | Borrower | Loan Amount |
|---|---|---|---|
| Previous Owner | Lyu Lii Hurng | $200,000 |
Source: Public Records
Tax History
| Year | Tax Paid | Tax Assessment Tax Assessment Total Assessment is a certain percentage of the fair market value that is determined by local assessors to be the total taxable value of land and additions on the property. | Land | Improvement |
|---|---|---|---|---|
| 2025 | $18,001 | $1,261,100 | $387,100 | $874,000 |
| 2024 | $17,509 | $1,189,000 | $357,400 | $831,600 |
| 2023 | $16,614 | $1,141,400 | $340,000 | $801,400 |
| 2022 | $16,614 | $1,070,500 | $316,500 | $754,000 |
| 2021 | $16,294 | $985,100 | $291,700 | $693,400 |
| 2020 | $18,016 | $1,129,500 | $286,900 | $842,600 |
| 2019 | $17,582 | $947,300 | $377,000 | $570,300 |
| 2018 | $17,364 | $947,300 | $377,000 | $570,300 |
| 2017 | $17,061 | $947,300 | $377,000 | $570,300 |
| 2016 | $16,597 | $947,300 | $377,000 | $570,300 |
| 2015 | $16,426 | $947,300 | $377,000 | $570,300 |
| 2014 | $16,284 | $947,300 | $377,000 | $570,300 |
Source: Public Records
Map
Nearby Homes
- 18 Vermont Dr
- 704 Evans St
- 643 Spring Ave
- 303 Pershing Ave
- 648 Falmouth Ave
- 801 Godwin Rd
- 86 Azalea St
- 82 Azalea St
- 615 Shelton Rd
- 780 Hilton Place
- 778 E Ridgewood Ave
- 1153 Linwood Ave
- 65 Edgewood Dr
- 602 Mill Run
- 364 Westfield Ave
- 163 Hampton Place
- 415 Linwood Ave
- 429 Fairway Rd
- 743 Boyd Rd
- 115 Southern Pkwy
- 63 Hollybrook Rd
- 56 Hollybrook Rd
- 113 Glen Ave
- 737 Paramus Rd
- 59 Hollybrook Rd
- 109 Glen Ave
- 52 Hollybrook Rd
- 6 Vermont Dr
- 2 Vermont Dr
- 10 Vermont Dr
- 105 Glen Ave
- 55 Hollybrook Rd
- 14 Vermont Dr
- 110 Glen Ave
- 742 Buchanan Ct
- 748 Buchanan Ct
- 729 Paramus Rd
- 48 Hollybrook Rd
- 753 Paramus Rd
- 51 Hollybrook Rd
Your Personal Tour Guide
Ask me questions while you tour the home.