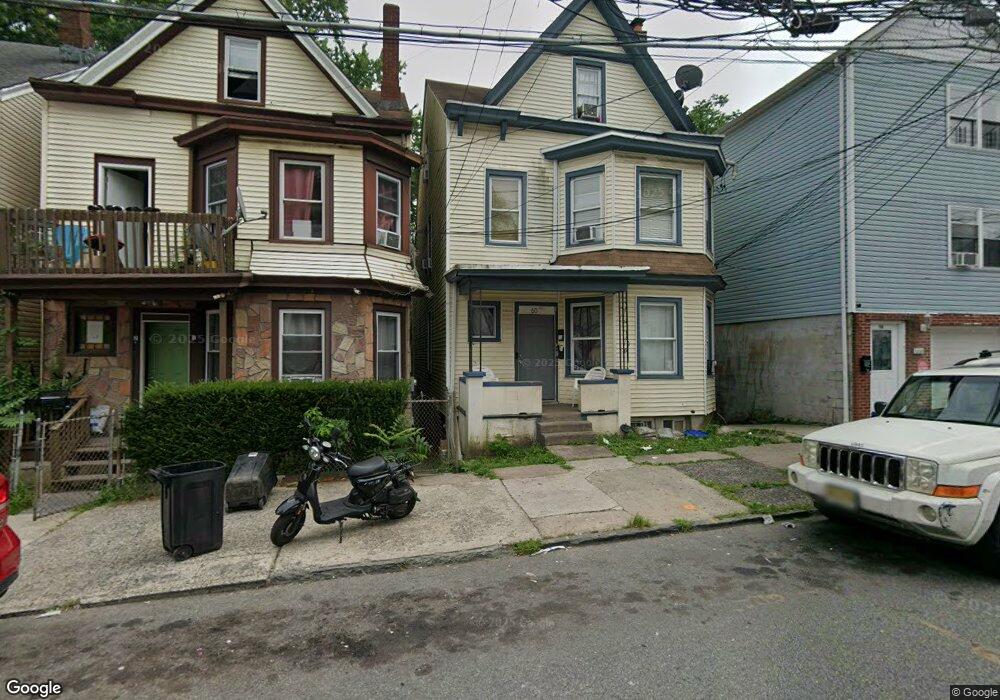
60 Hopper St Paterson, NJ 07522
Northside NeighborhoodEstimated Value: $412,000 - $706,000
--
Bed
--
Bath
2,317
Sq Ft
$247/Sq Ft
Est. Value
About This Home
This home is located at 60 Hopper St, Paterson, NJ 07522 and is currently estimated at $572,048, approximately $246 per square foot. 60 Hopper St is a home located in Passaic County with nearby schools including Edward W. Kilpatrick School of Discovery, Dale Avenue Elementary School, and Dr. Frank Napier, Jr. School of Technology.
Ownership History
Date
Name
Owned For
Owner Type
Purchase Details
Closed on
Aug 1, 2014
Sold by
Rivera Carlos M and Rivera Jasmine E
Bought by
Thompson Hyacinth M
Current Estimated Value
Home Financials for this Owner
Home Financials are based on the most recent Mortgage that was taken out on this home.
Original Mortgage
$114,350
Outstanding Balance
$87,289
Interest Rate
4.14%
Mortgage Type
New Conventional
Estimated Equity
$484,759
Purchase Details
Closed on
Nov 30, 2011
Sold by
Rivera Jasmine E
Bought by
Rivera Carlos M
Purchase Details
Closed on
Mar 31, 2011
Sold by
Syed Mubtagha S
Bought by
Khomut Matt
Purchase Details
Closed on
Feb 17, 2011
Sold by
Khomut Matt
Bought by
E And C Assets Llc
Purchase Details
Closed on
Aug 23, 2007
Sold by
Strack Milagros
Bought by
Syed Mubtagha S
Home Financials for this Owner
Home Financials are based on the most recent Mortgage that was taken out on this home.
Original Mortgage
$225,000
Interest Rate
6.74%
Mortgage Type
New Conventional
Purchase Details
Closed on
Jul 20, 2007
Sold by
Great Bear Construction
Bought by
Luque Zamira
Home Financials for this Owner
Home Financials are based on the most recent Mortgage that was taken out on this home.
Original Mortgage
$225,000
Interest Rate
6.74%
Mortgage Type
New Conventional
Purchase Details
Closed on
Jun 3, 2005
Sold by
Comninel John P
Bought by
Strack Milagros
Home Financials for this Owner
Home Financials are based on the most recent Mortgage that was taken out on this home.
Original Mortgage
$303,200
Interest Rate
5.63%
Purchase Details
Closed on
May 27, 2003
Sold by
Yepez Pilar
Bought by
Comininel John and Comininel Alexandra
Home Financials for this Owner
Home Financials are based on the most recent Mortgage that was taken out on this home.
Original Mortgage
$218,500
Interest Rate
5.77%
Purchase Details
Closed on
Nov 18, 2002
Sold by
Federal Home Loan Mortgage Corporation
Bought by
Yepez Pilar and Schaffer Raymond
Home Financials for this Owner
Home Financials are based on the most recent Mortgage that was taken out on this home.
Original Mortgage
$150,000
Interest Rate
6.34%
Create a Home Valuation Report for This Property
The Home Valuation Report is an in-depth analysis detailing your home's value as well as a comparison with similar homes in the area
Home Values in the Area
Average Home Value in this Area
Purchase History
| Date | Buyer | Sale Price | Title Company |
|---|---|---|---|
| Thompson Hyacinth M | $152,500 | Agent For Old Republic Natl | |
| Rivera Carlos M | $103,000 | -- | |
| Khomut Matt | $65,000 | -- | |
| E And C Assets Llc | $65,000 | -- | |
| Syed Mubtagha S | $300,000 | -- | |
| Luque Zamira | -- | -- | |
| Strack Milagros | $379,000 | -- | |
| Comininel John | $230,000 | -- | |
| Yepez Pilar | $121,000 | -- |
Source: Public Records
Mortgage History
| Date | Status | Borrower | Loan Amount |
|---|---|---|---|
| Open | Thompson Hyacinth M | $114,350 | |
| Previous Owner | Syed Mubtagha S | $225,000 | |
| Previous Owner | Strack Milagros | $303,200 | |
| Previous Owner | Comininel John | $218,500 | |
| Previous Owner | Yepez Pilar | $150,000 |
Source: Public Records
Tax History Compared to Growth
Tax History
| Year | Tax Paid | Tax Assessment Tax Assessment Total Assessment is a certain percentage of the fair market value that is determined by local assessors to be the total taxable value of land and additions on the property. | Land | Improvement |
|---|---|---|---|---|
| 2025 | $9,064 | $177,900 | $31,900 | $146,000 |
| 2024 | $8,722 | $177,900 | $31,900 | $146,000 |
| 2022 | $8,258 | $177,900 | $31,900 | $146,000 |
| 2021 | $7,963 | $177,900 | $31,900 | $146,000 |
| 2020 | $7,427 | $177,900 | $31,900 | $146,000 |
| 2019 | $7,193 | $174,000 | $31,400 | $142,600 |
| 2018 | $7,415 | $171,400 | $31,100 | $140,300 |
| 2017 | $7,076 | $170,100 | $30,900 | $139,200 |
| 2016 | $7,793 | $179,600 | $32,500 | $147,100 |
| 2015 | $7,378 | $179,600 | $32,500 | $147,100 |
| 2014 | $8,642 | $298,000 | $124,300 | $173,700 |
Source: Public Records
Map
Nearby Homes