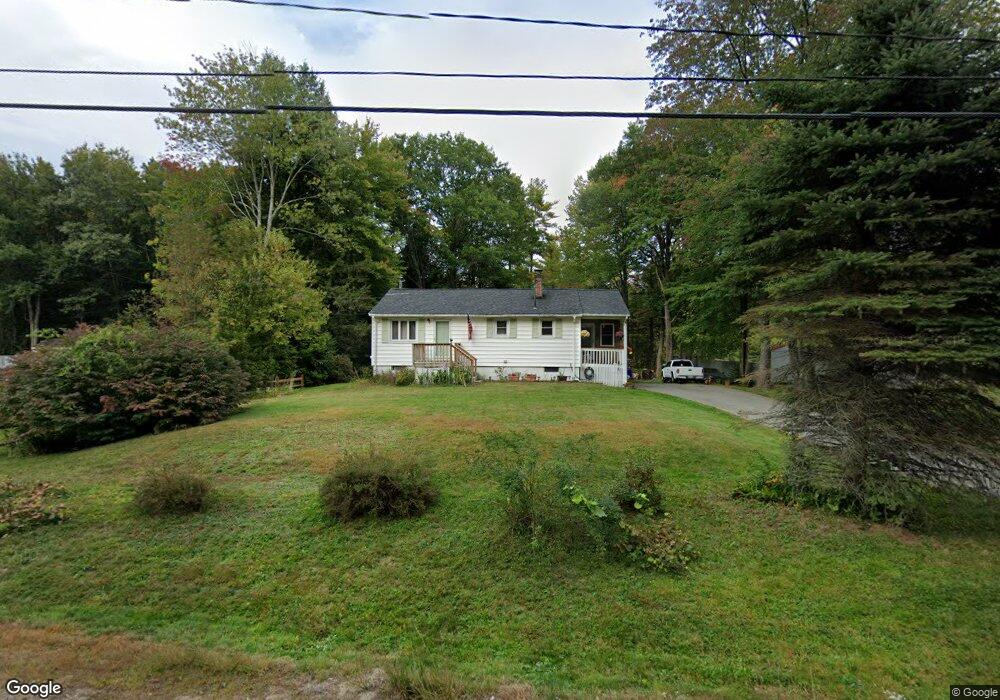
60 Hubbard Rd Berwick, ME 03901
Estimated Value: $359,460 - $440,000
3
Beds
1
Bath
992
Sq Ft
$399/Sq Ft
Est. Value
About This Home
This home is located at 60 Hubbard Rd, Berwick, ME 03901 and is currently estimated at $396,115, approximately $399 per square foot. 60 Hubbard Rd is a home located in York County with nearby schools including Noble High School and Tri-City Christian Academy.
Ownership History
Date
Name
Owned For
Owner Type
Purchase Details
Closed on
Mar 20, 2006
Sold by
Crovetti Terri J and Crovetti Brian
Bought by
Edwards Cynthia
Current Estimated Value
Home Financials for this Owner
Home Financials are based on the most recent Mortgage that was taken out on this home.
Original Mortgage
$140,000
Outstanding Balance
$77,325
Interest Rate
6.27%
Mortgage Type
Purchase Money Mortgage
Estimated Equity
$318,790
Create a Home Valuation Report for This Property
The Home Valuation Report is an in-depth analysis detailing your home's value as well as a comparison with similar homes in the area
Home Values in the Area
Average Home Value in this Area
Purchase History
| Date | Buyer | Sale Price | Title Company |
|---|---|---|---|
| Edwards Cynthia | -- | -- |
Source: Public Records
Mortgage History
| Date | Status | Borrower | Loan Amount |
|---|---|---|---|
| Open | Edwards Cynthia | $140,000 |
Source: Public Records
Tax History
| Year | Tax Paid | Tax Assessment Tax Assessment Total Assessment is a certain percentage of the fair market value that is determined by local assessors to be the total taxable value of land and additions on the property. | Land | Improvement |
|---|---|---|---|---|
| 2025 | $3,699 | $283,700 | $93,800 | $189,900 |
| 2024 | $3,538 | $283,700 | $93,800 | $189,900 |
| 2023 | $3,047 | $166,300 | $67,000 | $99,300 |
| 2022 | $3,030 | $166,300 | $67,000 | $99,300 |
| 2021 | $3,049 | $166,600 | $67,000 | $99,600 |
| 2020 | $3,225 | $166,600 | $67,000 | $99,600 |
| 2019 | $2,920 | $166,600 | $67,000 | $99,600 |
| 2018 | $2,812 | $159,800 | $61,000 | $98,800 |
| 2017 | $2,741 | $159,800 | $61,000 | $98,800 |
| 2016 | $2,613 | $160,300 | $61,000 | $99,300 |
| 2014 | $2,549 | $160,300 | $61,000 | $99,300 |
| 2013 | $2,557 | $159,300 | $61,000 | $98,300 |
Source: Public Records
Map
Nearby Homes
- 183 Rochester St
- 96 Rocky Hill Rd
- 148 Sullivan St
- 43 Otis Rd
- 13 Haflinger Ln
- 52 Lily Pond Rd
- 16 Bridge St
- 64 Maple St
- 1 Bridge St
- 101 School St
- 395 Route 108
- 46 Old Pine Hill Rd S
- 364 Pine Hill Rd
- 25 High St
- 13 Tomahawk Ln
- 53 Saw Mill Hill
- 23 Mount Vernon St
- 22 Lil Nor Ave
- 76 Goldrush Ln
- 85 Airport Dr
Your Personal Tour Guide
Ask me questions while you tour the home.