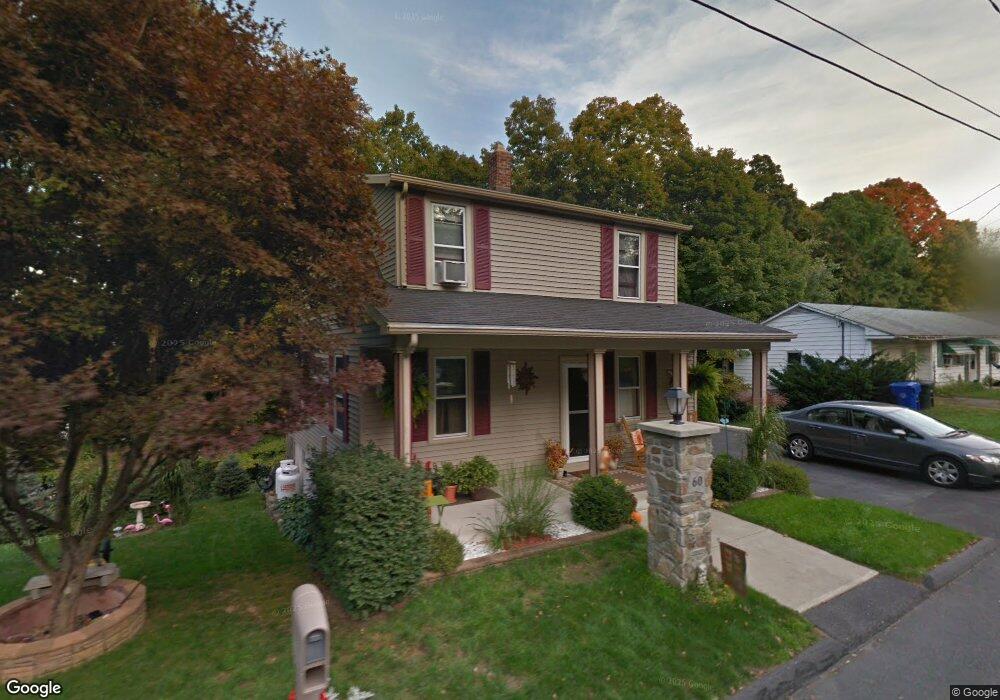
60 Johnson St Torrington, CT 06790
Estimated Value: $289,236 - $307,000
3
Beds
2
Baths
1,247
Sq Ft
$240/Sq Ft
Est. Value
About This Home
This home is located at 60 Johnson St, Torrington, CT 06790 and is currently estimated at $299,809, approximately $240 per square foot. 60 Johnson St is a home located in Litchfield County with nearby schools including Torrington Middle School, Torrington High School, and St. Peter School.
Ownership History
Date
Name
Owned For
Owner Type
Purchase Details
Closed on
Nov 21, 2024
Sold by
Snecinski Holly M
Bought by
Snecinski Holly M
Current Estimated Value
Home Financials for this Owner
Home Financials are based on the most recent Mortgage that was taken out on this home.
Original Mortgage
$367,500
Outstanding Balance
$367,383
Interest Rate
6.79%
Mortgage Type
Reverse Mortgage Home Equity Conversion Mortgage
Estimated Equity
-$67,574
Purchase Details
Closed on
Sep 1, 1989
Sold by
Lucey John
Bought by
Devaux Roger
Create a Home Valuation Report for This Property
The Home Valuation Report is an in-depth analysis detailing your home's value as well as a comparison with similar homes in the area
Home Values in the Area
Average Home Value in this Area
Purchase History
| Date | Buyer | Sale Price | Title Company |
|---|---|---|---|
| Snecinski Holly M | -- | None Available | |
| Snecinski Holly M | -- | None Available | |
| Snecinski Holly M | -- | None Available | |
| Devaux Roger | $119,000 | -- |
Source: Public Records
Mortgage History
| Date | Status | Borrower | Loan Amount |
|---|---|---|---|
| Open | Snecinski Holly M | $367,500 | |
| Closed | Snecinski Holly M | $367,500 | |
| Previous Owner | Devaux Roger | $159,900 | |
| Previous Owner | Devaux Roger | $18,000 |
Source: Public Records
Tax History
| Year | Tax Paid | Tax Assessment Tax Assessment Total Assessment is a certain percentage of the fair market value that is determined by local assessors to be the total taxable value of land and additions on the property. | Land | Improvement |
|---|---|---|---|---|
| 2025 | $6,643 | $172,760 | $22,610 | $150,150 |
| 2024 | $4,028 | $83,960 | $22,580 | $61,380 |
| 2023 | $4,027 | $83,960 | $22,580 | $61,380 |
| 2022 | $3,958 | $83,960 | $22,580 | $61,380 |
| 2021 | $3,876 | $83,960 | $22,580 | $61,380 |
| 2020 | $3,713 | $80,410 | $22,580 | $57,830 |
| 2019 | $3,567 | $77,250 | $27,730 | $49,520 |
| 2018 | $3,567 | $77,250 | $27,730 | $49,520 |
| 2017 | $3,534 | $77,250 | $27,730 | $49,520 |
| 2016 | $3,534 | $77,250 | $27,730 | $49,520 |
| 2015 | $3,534 | $77,250 | $27,730 | $49,520 |
| 2014 | $3,941 | $108,520 | $42,060 | $66,460 |
Source: Public Records
Map
Nearby Homes
- 0 Highland Ave Unit 24088105
- 95 Colorado Ave N
- 58 Eggleston St
- 80 Washington Ave
- 115 Beechwood Ave
- 146 Beechwood Ave
- 163 Beechwood Ave
- 329 Church St
- 108 Culvert St
- 116 High St
- 231 Beechwood Ave
- 30 Culvert St
- 155 Allen Rd
- 42 Pulver St
- 398 Funston Ave
- 7 Ford Ln
- 85 Ford Ln
- 00 Church St
- 68 Westledge Terrace
- 118 Pearl St
Your Personal Tour Guide
Ask me questions while you tour the home.