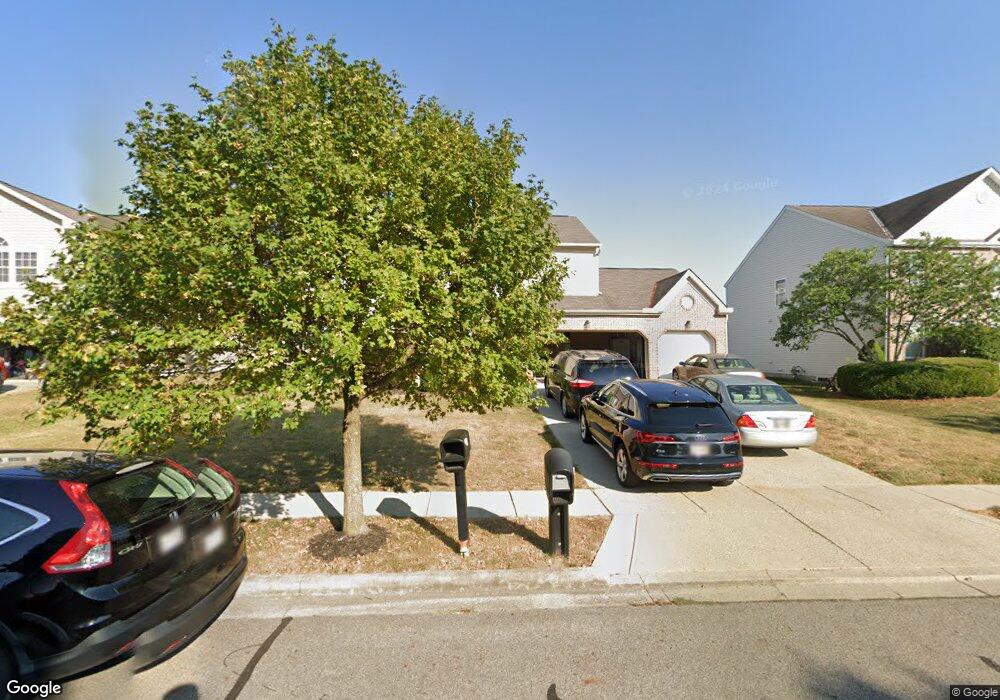
60 Langtree Dr Pickerington, OH 43147
Estimated Value: $414,488 - $448,000
4
Beds
4
Baths
2,470
Sq Ft
$175/Sq Ft
Est. Value
About This Home
This home is located at 60 Langtree Dr, Pickerington, OH 43147 and is currently estimated at $432,122, approximately $174 per square foot. 60 Langtree Dr is a home located in Fairfield County with nearby schools including Pickerington Elementary School, Diley Middle School, and Pickerington Ridgeview Junior High School.
Ownership History
Date
Name
Owned For
Owner Type
Purchase Details
Closed on
Jan 12, 2023
Sold by
Khan Basith A
Bought by
Bahauddin Shafi and Khan Naseem U
Current Estimated Value
Home Financials for this Owner
Home Financials are based on the most recent Mortgage that was taken out on this home.
Original Mortgage
$250,000
Outstanding Balance
$240,767
Interest Rate
6.33%
Mortgage Type
New Conventional
Estimated Equity
$191,355
Purchase Details
Closed on
Apr 14, 2009
Sold by
Shafi Bahauddin and Unnisa Naseem
Bought by
Khan Basith A
Purchase Details
Closed on
Jun 20, 2008
Sold by
Kahn Basith A
Bought by
Bahauddin Shafi and Unnisa Naseem
Purchase Details
Closed on
Jul 25, 2006
Sold by
Maronda Homes Inc Of Ohio
Bought by
Khan Basith A
Home Financials for this Owner
Home Financials are based on the most recent Mortgage that was taken out on this home.
Original Mortgage
$150,600
Interest Rate
6.77%
Mortgage Type
Purchase Money Mortgage
Create a Home Valuation Report for This Property
The Home Valuation Report is an in-depth analysis detailing your home's value as well as a comparison with similar homes in the area
Home Values in the Area
Average Home Value in this Area
Purchase History
| Date | Buyer | Sale Price | Title Company |
|---|---|---|---|
| Bahauddin Shafi | $360,000 | -- | |
| Khan Basith A | -- | World Class Title Agency Of | |
| Bahauddin Shafi | -- | Valmer Land Title Agency | |
| Khan Basith A | $207,100 | Stewart Title Agency |
Source: Public Records
Mortgage History
| Date | Status | Borrower | Loan Amount |
|---|---|---|---|
| Open | Bahauddin Shafi | $250,000 | |
| Previous Owner | Khan Basith A | $150,600 |
Source: Public Records
Tax History
| Year | Tax Paid | Tax Assessment Tax Assessment Total Assessment is a certain percentage of the fair market value that is determined by local assessors to be the total taxable value of land and additions on the property. | Land | Improvement |
|---|---|---|---|---|
| 2025 | $12,018 | $130,820 | $34,270 | $96,550 |
| 2024 | $12,018 | $97,630 | $11,990 | $85,640 |
| 2023 | $4,715 | $97,630 | $11,990 | $85,640 |
| 2022 | $4,731 | $97,630 | $11,990 | $85,640 |
| 2021 | $4,242 | $74,500 | $11,990 | $62,510 |
| 2020 | $4,288 | $74,500 | $11,990 | $62,510 |
| 2019 | $4,315 | $74,500 | $11,990 | $62,510 |
| 2018 | $4,241 | $65,640 | $11,990 | $53,650 |
| 2017 | $4,248 | $63,790 | $10,000 | $53,790 |
| 2016 | $4,228 | $63,790 | $10,000 | $53,790 |
| 2015 | $4,160 | $59,350 | $10,000 | $49,350 |
| 2014 | $4,113 | $59,350 | $10,000 | $49,350 |
| 2013 | $4,113 | $59,350 | $10,000 | $49,350 |
Source: Public Records
Map
Nearby Homes
- 43 Langtree Dr
- 176 Knights Bridge Dr E
- 10367 Long Nw Rd
- 353 Florence Dr
- 136 Pioneer Cir
- 148 Georges Creek Dr
- 195 Parkwood Ave
- 113 Urich Dr
- 292 Maple Place
- 140 Robinette St
- 368 Colony Park Dr
- 149 Lorrimore Dr
- 148 Lorrimore Dr
- 155 Lorrimore Dr
- 160 Lorrimore Dr
- 192 England St
- 108 Gold Finch St
- 163 Lorrimore Dr
- 223 Antrim St
- 116 Gold Finch St
- 56 Langtree Dr
- 64 Langtree Dr
- 64 Langtree Dr Unit 83
- 55 Grisby Ln
- 51 Grisby Ln
- 59 Grisby Ln
- 52 Langtree Dr
- 59 Langtree Dr
- 59 Langtree Dr Unit Lot 63
- 51 Langtree Dr
- 49 Grisby Ln
- 47 Langtree Dr
- 849 Avalon Dr
- 845 Avalon Dr
- 853 Avalon Dr
- 853 Avalon Dr Unit 37
- 838 Avalon Dr
- 45 Grisby Ln
- 841 Avalon Dr
- 857 Avalon Dr
Your Personal Tour Guide
Ask me questions while you tour the home.