Estimated Value: $502,556 - $632,000
6
Beds
4
Baths
3,644
Sq Ft
$161/Sq Ft
Est. Value
About This Home
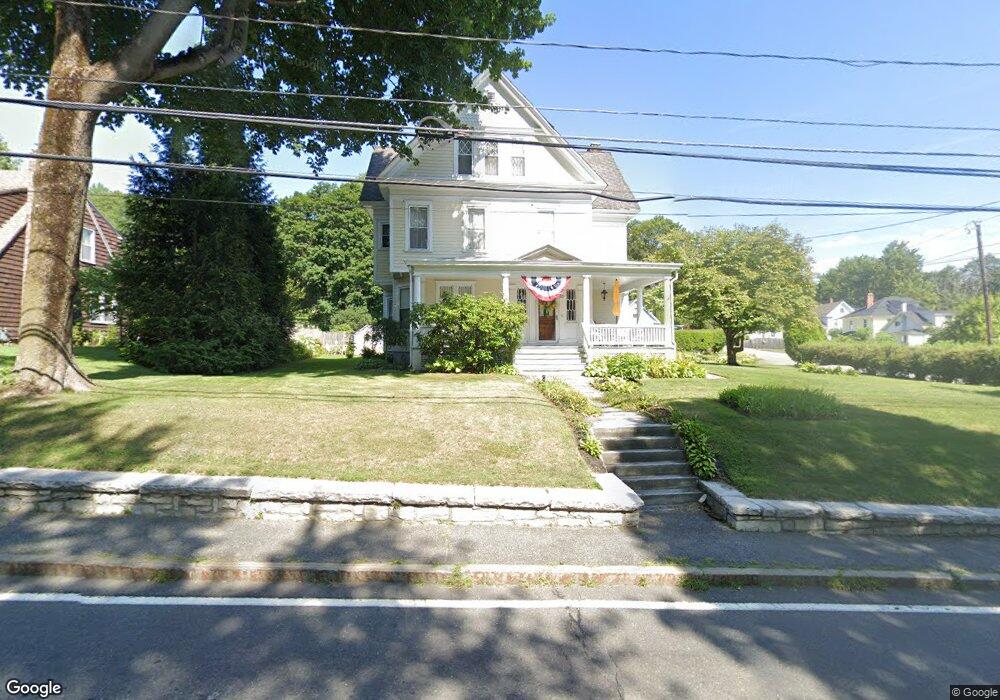
This home is located at 60 Laurel St, Lee, MA 01238 and is currently estimated at $588,389, approximately $161 per square foot. 60 Laurel St is a home located in Berkshire County with nearby schools including Lee Elementary School, Lee Middle/High School, and St. Mary's School.
Ownership History
Date
Name
Owned For
Owner Type
Purchase Details
Closed on
Jul 15, 1993
Sold by
Jirak Robert W and Jirak Margaret F
Bought by
Celentano Philip G and Celentano Michelle L
Current Estimated Value
Create a Home Valuation Report for This Property
The Home Valuation Report is an in-depth analysis detailing your home's value as well as a comparison with similar homes in the area
Home Values in the Area
Average Home Value in this Area
Purchase History
We collect this data history from publicly available records. To have your information removed, we recommend requesting removal directly through your county’s website.
| Date | Buyer | Sale Price | Title Company |
|---|---|---|---|
| Celentano Philip G | $180,000 | -- |
Source: Public Records
Mortgage History
We collect this data history from publicly available records. To have your information removed, we recommend requesting removal directly through your county’s website.
| Date | Status | Borrower | Loan Amount |
|---|---|---|---|
| Open | Celentano Philip G | $175,000 | |
| Closed | Celentano Philip G | $132,000 | |
| Closed | Celentano Philip G | $33,000 |
Source: Public Records
Tax History
| Year | Tax Paid | Tax Assessment Tax Assessment Total Assessment is a certain percentage of the fair market value that is determined by local assessors to be the total taxable value of land and additions on the property. | Land | Improvement |
|---|---|---|---|---|
| 2025 | $5,135 | $456,400 | $73,200 | $383,200 |
| 2024 | $5,464 | $486,100 | $71,400 | $414,700 |
| 2023 | $5,148 | $435,200 | $68,200 | $367,000 |
| 2022 | $4,535 | $332,200 | $58,800 | $273,400 |
| 2021 | $4,621 | $314,800 | $55,600 | $259,200 |
| 2020 | $4,335 | $295,300 | $53,300 | $242,000 |
| 2019 | $4,558 | $308,400 | $59,000 | $249,400 |
| 2018 | $4,477 | $306,000 | $59,000 | $247,000 |
| 2017 | $4,487 | $304,800 | $59,000 | $245,800 |
| 2016 | $4,493 | $308,600 | $62,800 | $245,800 |
| 2015 | $4,345 | $308,600 | $62,800 | $245,800 |
| 2014 | $4,306 | $304,300 | $57,100 | $247,200 |
Source: Public Records
Map
Nearby Homes
- 155 Laurel St
- 180 Center St
- 82 Dublin St
- 205 High St
- 160 High St
- 80 S Prospect St
- 2 Devon Rd
- 100 S Prospect St
- 50 Mountain View Terrace
- 615 Laurel St
- 0 East St Unit 235893
- 53 Tabar Ave
- 15 Martin Ave
- 135 East St
- 880 East St Unit 14B
- 85 Via Franco
- 524 Walker St
- 11 Lawton St
- 155 Water St Unit 5
- 555 Marble St
Your Personal Tour Guide
Ask me questions while you tour the home.