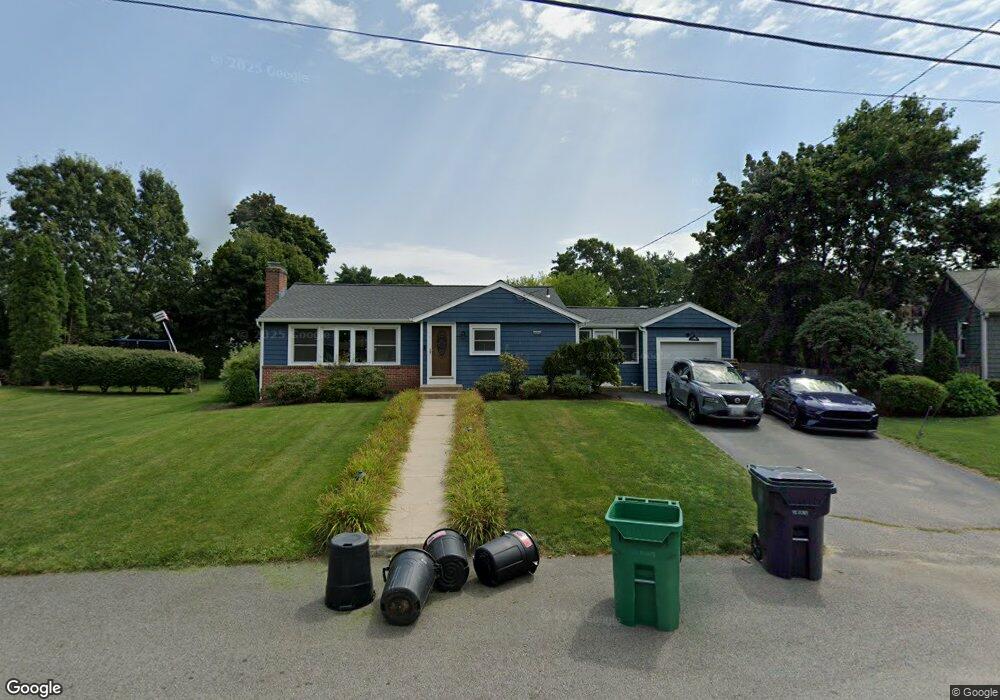
60 Leslie Rd Warwick, RI 02888
Spring Green NeighborhoodEstimated Value: $394,155 - $442,000
3
Beds
1
Bath
1,568
Sq Ft
$268/Sq Ft
Est. Value
About This Home
This home is located at 60 Leslie Rd, Warwick, RI 02888 and is currently estimated at $420,289, approximately $268 per square foot. 60 Leslie Rd is a home located in Kent County with nearby schools including St. Peter School and Saint Paul School.
Ownership History
Date
Name
Owned For
Owner Type
Purchase Details
Closed on
Feb 26, 2013
Sold by
Oneill 3Rd Robert E and Oneill Stacy
Bought by
Oneill 3Rd Robert E and Oneill Stacy
Current Estimated Value
Purchase Details
Closed on
Sep 24, 2009
Sold by
Pimentel Fernando
Bought by
Oneill 3Rd Robert E and Allen Stacy
Home Financials for this Owner
Home Financials are based on the most recent Mortgage that was taken out on this home.
Original Mortgage
$192,307
Interest Rate
5.31%
Mortgage Type
Purchase Money Mortgage
Purchase Details
Closed on
Feb 26, 2003
Sold by
Goodale Cynthia P
Bought by
Pimental Fernando L
Home Financials for this Owner
Home Financials are based on the most recent Mortgage that was taken out on this home.
Original Mortgage
$48,500
Interest Rate
5.98%
Mortgage Type
Purchase Money Mortgage
Create a Home Valuation Report for This Property
The Home Valuation Report is an in-depth analysis detailing your home's value as well as a comparison with similar homes in the area
Home Values in the Area
Average Home Value in this Area
Purchase History
| Date | Buyer | Sale Price | Title Company |
|---|---|---|---|
| Oneill 3Rd Robert E | -- | -- | |
| Oneill 3Rd Robert E | $199,900 | -- | |
| Pimental Fernando L | $163,500 | -- |
Source: Public Records
Mortgage History
| Date | Status | Borrower | Loan Amount |
|---|---|---|---|
| Previous Owner | Pimental Fernando L | $33,700 | |
| Previous Owner | Pimental Fernando L | $192,307 | |
| Previous Owner | Pimental Fernando L | $48,500 | |
| Previous Owner | Pimental Fernando L | $36,000 |
Source: Public Records
Tax History Compared to Growth
Tax History
| Year | Tax Paid | Tax Assessment Tax Assessment Total Assessment is a certain percentage of the fair market value that is determined by local assessors to be the total taxable value of land and additions on the property. | Land | Improvement |
|---|---|---|---|---|
| 2025 | $4,547 | $358,000 | $114,800 | $243,200 |
| 2024 | $4,384 | $303,000 | $99,800 | $203,200 |
| 2023 | $4,300 | $303,000 | $99,800 | $203,200 |
| 2022 | $3,755 | $200,500 | $61,900 | $138,600 |
| 2021 | $3,735 | $199,400 | $61,900 | $137,500 |
| 2020 | $3,735 | $199,400 | $61,900 | $137,500 |
| 2019 | $3,735 | $199,400 | $61,900 | $137,500 |
| 2018 | $3,332 | $160,200 | $55,000 | $105,200 |
| 2017 | $3,242 | $160,200 | $55,000 | $105,200 |
| 2016 | $3,242 | $160,200 | $55,000 | $105,200 |
| 2015 | $3,538 | $170,500 | $78,300 | $92,200 |
| 2014 | $3,420 | $170,500 | $78,300 | $92,200 |
| 2013 | $3,374 | $170,500 | $78,300 | $92,200 |
Source: Public Records
Map
Nearby Homes
- 126 Fairfax Dr
- 1052 Post Rd
- 208 Negansett Ave
- 110 Pilgrim Pkwy Unit 8
- 63 Massasoit Dr
- 63 Benbridge Ave
- 447 Harrington Ave
- 1153 Post Rd
- 93 Easton Ave
- 169 Partition St
- 341 Sumner Ave
- 40 Easton Ave
- 56 Partition St
- 23 Stoddard Place
- 845 Warwick Ave
- 35 Welfare Ave
- 93 Grotto Ave
- 396 Elm St
- 27 Frederick St
- 158 Underwood Ave