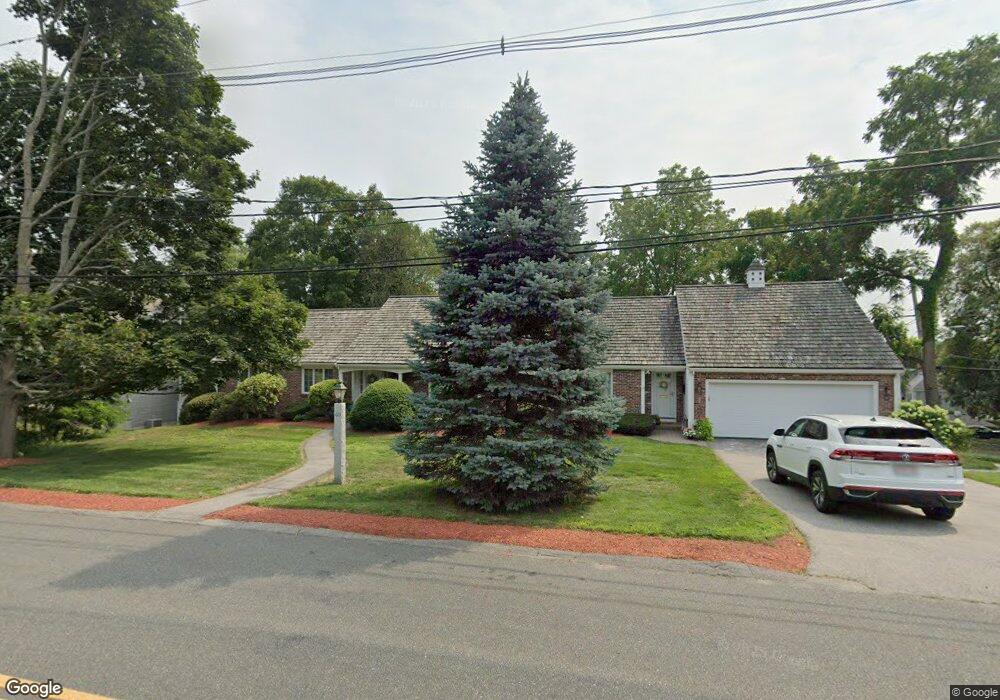
60 Lindall St Danvers, MA 01923
Estimated Value: $903,000 - $976,000
3
Beds
3
Baths
2,761
Sq Ft
$340/Sq Ft
Est. Value
About This Home
This home is located at 60 Lindall St, Danvers, MA 01923 and is currently estimated at $939,667, approximately $340 per square foot. 60 Lindall St is a home located in Essex County with nearby schools including St. Mary of the Annunciation School and St. John's Prep.
Ownership History
Date
Name
Owned For
Owner Type
Purchase Details
Closed on
Aug 11, 2015
Sold by
Guarente Joseph and Guarente Joan M
Bought by
Guarente Joseph and Guarente Joan M
Current Estimated Value
Purchase Details
Closed on
May 6, 2013
Sold by
Guarente Joseph
Bought by
Guarente Joseph and Wilkins Joan M
Purchase Details
Closed on
Jun 5, 2012
Sold by
Mary Guarente T and Mary Legrow
Bought by
Guarente Joseph
Purchase Details
Closed on
May 16, 1975
Bought by
Guarente Joseph and Guarente Joan M
Create a Home Valuation Report for This Property
The Home Valuation Report is an in-depth analysis detailing your home's value as well as a comparison with similar homes in the area
Home Values in the Area
Average Home Value in this Area
Purchase History
| Date | Buyer | Sale Price | Title Company |
|---|---|---|---|
| Guarente Joseph | -- | -- | |
| Guarente Joseph | -- | -- | |
| Guarente Joseph | -- | -- | |
| Guarente Joseph | -- | -- | |
| Guarente Joseph | -- | -- | |
| Guarente Joseph | -- | -- |
Source: Public Records
Tax History Compared to Growth
Tax History
| Year | Tax Paid | Tax Assessment Tax Assessment Total Assessment is a certain percentage of the fair market value that is determined by local assessors to be the total taxable value of land and additions on the property. | Land | Improvement |
|---|---|---|---|---|
| 2025 | $8,590 | $781,600 | $379,000 | $402,600 |
| 2024 | $8,382 | $754,500 | $366,200 | $388,300 |
| 2023 | $8,183 | $696,400 | $332,900 | $363,500 |
| 2022 | $7,994 | $631,400 | $302,100 | $329,300 |
| 2021 | $7,404 | $554,600 | $279,000 | $275,600 |
| 2020 | $7,243 | $554,600 | $279,000 | $275,600 |
| 2019 | $6,906 | $520,000 | $244,400 | $275,600 |
| 2018 | $6,593 | $486,900 | $239,200 | $247,700 |
| 2017 | $6,840 | $482,000 | $238,000 | $244,000 |
| 2016 | $6,485 | $456,700 | $225,100 | $231,600 |
| 2015 | $5,974 | $400,700 | $186,700 | $214,000 |
Source: Public Records
Map
Nearby Homes
- 4 Butler Ave
- 35 Locust St Unit 3
- 6 Kimberly Dr
- 25 Cherry St Unit 3
- 14 Williams St Unit C17
- 8 Putnam St Unit 3
- 12 Whipple St
- 37 Holten St Unit 2
- 11 Holten St
- 42 Coolidge Rd
- 35 High St Unit 3D
- 38 High St Unit 4
- 4 Brookvale Dr
- 5 Beacon St
- 100 Poplar St
- 12 Exeter St
- 20 Ash St Unit 3
- 20 Ash St Unit 1
- 10 Colantoni Dr
- 14 1/2 Hampshire St
- 58 Lindall St
- 12 Burley Ave
- 8 Burley Ave
- 177 Maple St
- 59 Lindall St
- 175 Maple St Unit 2
- 175 Maple St Unit 1
- 175 Maple St
- 175 Maple St Unit 175
- 171 Maple St
- 61 Lindall St
- 57 Lindall St
- 57 Lindall St Unit 1
- 57 Lindall St Unit 2
- 179 Maple St
- 54 Lindall St
- 181 Maple St
- 64 Lindall St
- 21 Burley Ave
- 63 Lindall St