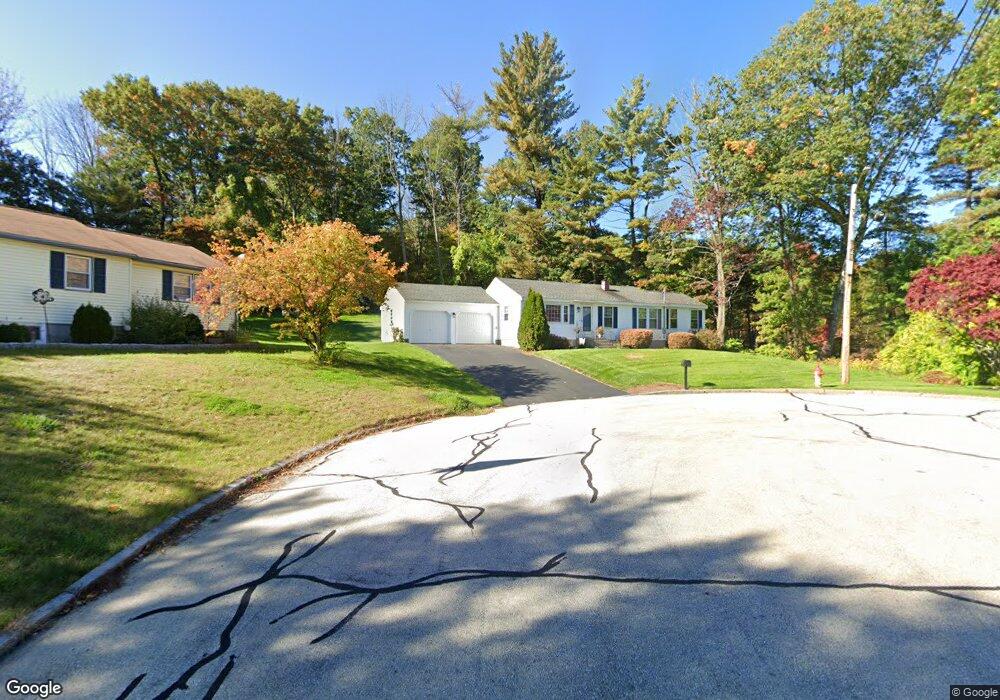
60 Martel Dr Manchester, NH 03103
Southside NeighborhoodEstimated Value: $452,000 - $489,000
3
Beds
1
Bath
1,184
Sq Ft
$398/Sq Ft
Est. Value
About This Home
This home is located at 60 Martel Dr, Manchester, NH 03103 and is currently estimated at $471,080, approximately $397 per square foot. 60 Martel Dr is a home located in Hillsborough County with nearby schools including Henry J. McLaughlin Middle School, Manchester Memorial High School, and The Founders Academy Charter School (El).
Ownership History
Date
Name
Owned For
Owner Type
Purchase Details
Closed on
Jun 22, 2016
Sold by
Peter M Samon
Bought by
Tack Gregg and Tack Susan
Current Estimated Value
Home Financials for this Owner
Home Financials are based on the most recent Mortgage that was taken out on this home.
Original Mortgage
$34,750
Outstanding Balance
$27,630
Interest Rate
3.54%
Estimated Equity
$443,450
Purchase Details
Closed on
Dec 2, 1998
Sold by
Baldinelli Philip D and Baldinelli Dawn G
Bought by
Tack Gregg D and Tack Susan D
Create a Home Valuation Report for This Property
The Home Valuation Report is an in-depth analysis detailing your home's value as well as a comparison with similar homes in the area
Home Values in the Area
Average Home Value in this Area
Purchase History
| Date | Buyer | Sale Price | Title Company |
|---|---|---|---|
| Tack Gregg | -- | -- | |
| Tack Gregg D | $105,000 | -- |
Source: Public Records
Mortgage History
| Date | Status | Borrower | Loan Amount |
|---|---|---|---|
| Open | Tack Gregg D | $34,750 | |
| Closed | Tack Gregg D | -- | |
| Previous Owner | Tack Gregg D | $148,000 | |
| Previous Owner | Tack Gregg D | $50,000 |
Source: Public Records
Tax History Compared to Growth
Tax History
| Year | Tax Paid | Tax Assessment Tax Assessment Total Assessment is a certain percentage of the fair market value that is determined by local assessors to be the total taxable value of land and additions on the property. | Land | Improvement |
|---|---|---|---|---|
| 2024 | $6,336 | $323,600 | $115,100 | $208,500 |
| 2023 | $6,103 | $323,600 | $115,100 | $208,500 |
| 2022 | $5,902 | $323,600 | $115,100 | $208,500 |
| 2021 | $5,721 | $323,600 | $115,100 | $208,500 |
| 2020 | $5,309 | $215,300 | $79,400 | $135,900 |
| 2019 | $5,236 | $215,300 | $79,400 | $135,900 |
| 2018 | $5,098 | $215,300 | $79,400 | $135,900 |
| 2017 | $5,021 | $215,300 | $79,400 | $135,900 |
| 2016 | $4,982 | $215,300 | $79,400 | $135,900 |
| 2015 | $4,988 | $212,800 | $73,500 | $139,300 |
| 2014 | $5,001 | $212,800 | $73,500 | $139,300 |
| 2013 | $4,824 | $212,800 | $73,500 | $139,300 |
Source: Public Records
Map
Nearby Homes