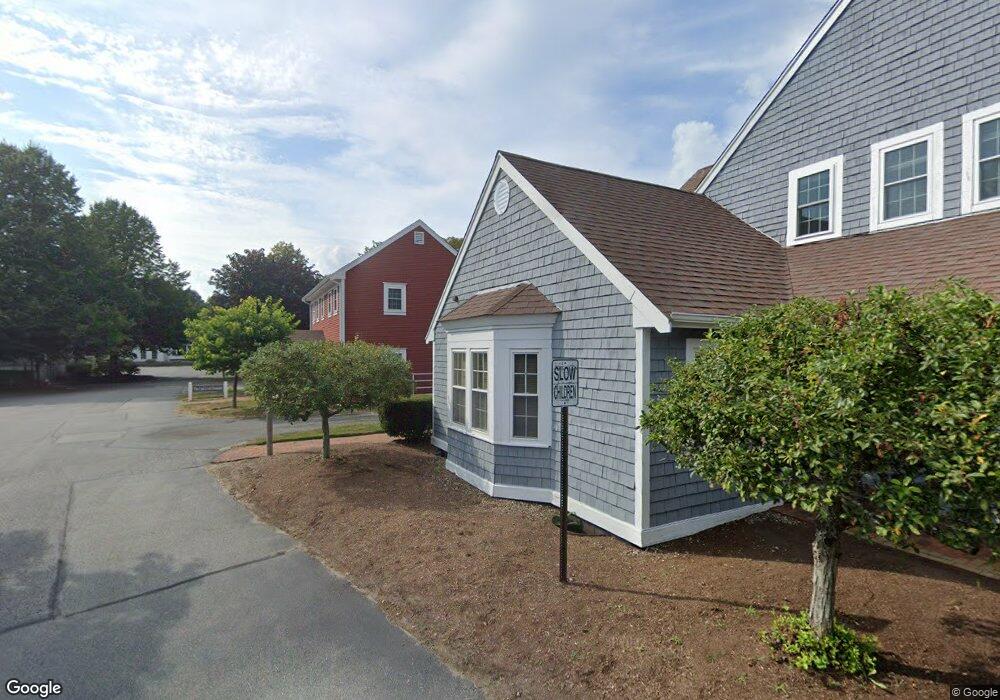
60 Munson Meeting Way Unit C Chatham, MA 2633
Chatham Village NeighborhoodEstimated Value: $388,933
--
Bed
--
Bath
1,915
Sq Ft
$203/Sq Ft
Est. Value
About This Home
This home is located at 60 Munson Meeting Way Unit C, Chatham, MA 2633 and is currently estimated at $388,933, approximately $203 per square foot. 60 Munson Meeting Way Unit C is a home located in Barnstable County with nearby schools including Chatham Elementary School, Harwich Elementary School, and Monomoy Regional Middle School.
Ownership History
Date
Name
Owned For
Owner Type
Purchase Details
Closed on
Oct 7, 2021
Sold by
Whaley Marc A and Whaley Carol G
Bought by
60 Munson Meeting Way Llc
Current Estimated Value
Purchase Details
Closed on
Aug 18, 2020
Sold by
Whaley Marc A and Whaley Carol G
Bought by
Whaley Carol G and Whaley Marc A
Purchase Details
Closed on
Jun 16, 2006
Sold by
Whaley Marc A
Bought by
Whaley Carol G and Whaley Marc A
Purchase Details
Closed on
Mar 10, 2005
Sold by
Whaley Kimberlee K and Whaley Marc A
Bought by
Whaley Marc A
Purchase Details
Closed on
Dec 16, 1993
Sold by
Cape Cod Bk & Tr Co
Bought by
Whaley Marc A
Home Financials for this Owner
Home Financials are based on the most recent Mortgage that was taken out on this home.
Original Mortgage
$58,300
Interest Rate
7.03%
Mortgage Type
Commercial
Create a Home Valuation Report for This Property
The Home Valuation Report is an in-depth analysis detailing your home's value as well as a comparison with similar homes in the area
Home Values in the Area
Average Home Value in this Area
Purchase History
| Date | Buyer | Sale Price | Title Company |
|---|---|---|---|
| 60 Munson Meeting Way Llc | $290,000 | None Available | |
| Whaley Carol G | -- | None Available | |
| Whaley Carol G | -- | -- | |
| Whaley Marc A | -- | -- | |
| Whaley Marc A | $64,400 | -- |
Source: Public Records
Mortgage History
| Date | Status | Borrower | Loan Amount |
|---|---|---|---|
| Previous Owner | Whaley Marc A | $58,300 |
Source: Public Records
Tax History Compared to Growth
Tax History
| Year | Tax Paid | Tax Assessment Tax Assessment Total Assessment is a certain percentage of the fair market value that is determined by local assessors to be the total taxable value of land and additions on the property. | Land | Improvement |
|---|---|---|---|---|
| 2025 | $803 | $231,300 | $0 | $231,300 |
| 2024 | $794 | $222,400 | $0 | $222,400 |
| 2023 | $728 | $187,500 | $0 | $187,500 |
| 2022 | $814 | $176,200 | $0 | $176,200 |
| 2021 | $864 | $173,500 | $0 | $173,500 |
| 2020 | $832 | $172,700 | $0 | $172,700 |
| 2019 | $848 | $174,800 | $0 | $174,800 |
| 2018 | $834 | $171,300 | $0 | $171,300 |
| 2017 | $836 | $166,300 | $0 | $166,300 |
| 2016 | $827 | $164,800 | $0 | $164,800 |
| 2015 | $822 | $164,800 | $0 | $164,800 |
| 2014 | $837 | $164,800 | $0 | $164,800 |
Source: Public Records
Map
Nearby Homes
- 745 Main St
- 231 Crowell Rd
- 27 Martha Kendrick Dr
- 12 Pond St
- 99 Uncle Alberts Drive Extension
- 230 Barcliff Ave
- 39 Meadow Brook Rd
- 92 Barcliff Ave
- 23 Shane Dr
- 85 Cedar St
- 93 Orleans Rd
- 111 Enterprise Dr
- 14 Pond View Ln
- 207 Horizon Dr
- 292 Stage Harbor Rd
- 450 Main St
- 109 Misty Meadow Ln Unit 2
- 109 Misty Meadow Ln Unit 4
- 287 Cedar St
- 56 Skyline Dr
- 60 Munson Meeting Way Unit 23&2
- 60 Munson Meeting Way
- 60 Munson Meeting Way Unit H
- 60 Munson Meeting Way Unit G
- 60 Munson Meeting Way Unit D
- 60 Munson Meeting Way Unit F
- 60 Munson Meeting Way Unit B
- 60 Munson Meeting Way Unit A
- 60 Munson Meeting Way Unit I
- 60 Munson Meeting Way Unit E
- 38 Munson Meeting Way Unit F
- 38 Munson Meeting Way Unit E
- 38 Munson Meeting Way Unit D
- 38 Munson Meeting Way Unit C
- 38 Munson Meeting Way Unit B
- 38 Munson Meeting Way Unit A
- 38 Munson Meeting Way
- 38 Munson Meeting Way Unit 38
- 38 Munson Meeting Way Unit 20
- 38 Munson Meeting Way Unit 19