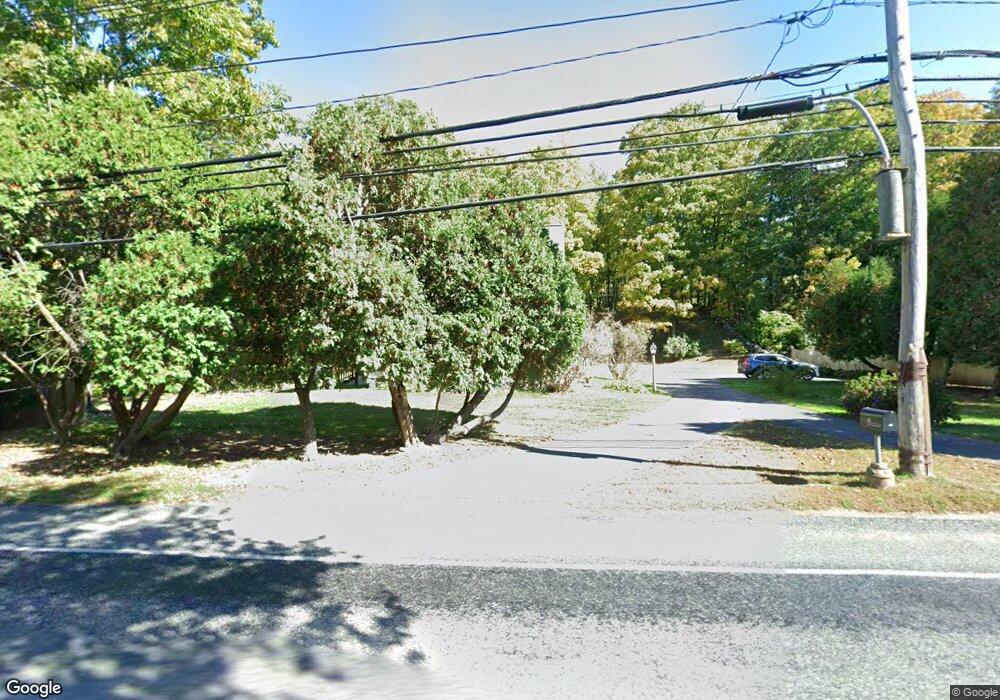
60 N Main St Sherborn, MA 01770
Estimated Value: $773,771 - $969,000
3
Beds
1
Bath
1,697
Sq Ft
$531/Sq Ft
Est. Value
About This Home
This home is located at 60 N Main St, Sherborn, MA 01770 and is currently estimated at $901,443, approximately $531 per square foot. 60 N Main St is a home located in Middlesex County with nearby schools including Pine Hill Elementary School, Dover-Sherborn Regional Middle School, and Dover-Sherborn Regional High School.
Ownership History
Date
Name
Owned For
Owner Type
Purchase Details
Closed on
Dec 23, 2013
Sold by
Kensington Speen 2 Llc
Bought by
Mcref Natick Developme
Current Estimated Value
Purchase Details
Closed on
Jan 7, 2008
Sold by
Bemis Marion Gwen and Johnson Marion Gwen
Bought by
North Main Street Rt and Johnson
Create a Home Valuation Report for This Property
The Home Valuation Report is an in-depth analysis detailing your home's value as well as a comparison with similar homes in the area
Home Values in the Area
Average Home Value in this Area
Purchase History
| Date | Buyer | Sale Price | Title Company |
|---|---|---|---|
| Mcref Natick Developme | $7,063,870 | -- | |
| Kensington Speen 2 Llc | $1,500,000 | -- | |
| Mcref Natick Developme | $7,063,870 | -- | |
| Kensington Speen 2 Llc | $1,500,000 | -- | |
| North Main Street Rt | -- | -- | |
| North Main Street Rt | -- | -- | |
| North Main Street Rt | -- | -- | |
| Mcref Natick Developme | $7,063,870 | -- |
Source: Public Records
Mortgage History
| Date | Status | Borrower | Loan Amount |
|---|---|---|---|
| Previous Owner | North Main Street Rt | $65,000 | |
| Previous Owner | North Main Street Rt | $30,000 |
Source: Public Records
Tax History
| Year | Tax Paid | Tax Assessment Tax Assessment Total Assessment is a certain percentage of the fair market value that is determined by local assessors to be the total taxable value of land and additions on the property. | Land | Improvement |
|---|---|---|---|---|
| 2025 | $11,022 | $664,800 | $355,600 | $309,200 |
| 2024 | $10,201 | $601,800 | $293,800 | $308,000 |
| 2023 | $9,918 | $550,700 | $293,800 | $256,900 |
| 2022 | $9,728 | $511,200 | $293,800 | $217,400 |
| 2021 | $9,102 | $467,600 | $293,800 | $173,800 |
| 2020 | $8,926 | $458,700 | $293,800 | $164,900 |
| 2019 | $8,825 | $449,800 | $293,800 | $156,000 |
| 2018 | $8,681 | $449,800 | $293,800 | $156,000 |
| 2017 | $8,544 | $417,600 | $279,200 | $138,400 |
| 2016 | $8,590 | $417,600 | $279,200 | $138,400 |
| 2015 | $8,390 | $412,900 | $271,300 | $141,600 |
| 2014 | $8,002 | $393,400 | $254,700 | $138,700 |
Source: Public Records
Map
Nearby Homes
- 8 Washington St
- 124 Everett St
- 63 Farm Road Lot 5
- 13 Morgan Dr Unit 109
- 137 Lake St
- 6 Hopewell Farm Rd
- 11 Wyndemere Ln
- 17 Wyndemere Ln
- 90 Maple St
- 14 Sewall Brook Ln
- 102 Washington St
- 216-218 S Main St
- 79 Speen St
- 75 Cottage St
- 2 Walden Dr Unit 2
- 74 Kendall Ave
- 91 Speen St
- 6 Post Oak Ln Unit 9
- 27 Stillman St
- 47 Kendall Ave
- 58 N Main St
- 1 Butler St
- 61 N Main St
- 59 N Main St
- 59 N Main St Unit 11
- 59 N Main St Unit 10
- 59 N Main St Unit 9
- 59 N Main St Unit 8
- 59 N Main St Unit 7
- 59 N Main St Unit 3
- 59 N Main St Unit 5
- 54 N Main St
- 55 N Main St
- 5 Butler St
- Lot 1A N Main St
- 51 N Main St
- 49 N Main St
- 46 N Main St
- 84 N Main St
- 4 Butler St
Your Personal Tour Guide
Ask me questions while you tour the home.