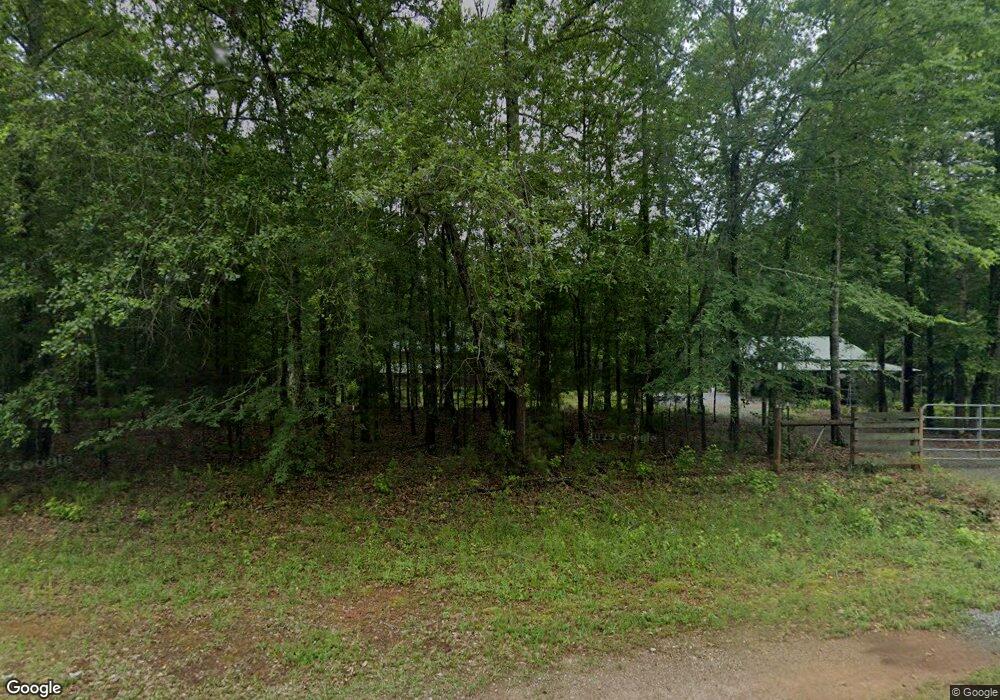
60 Old Zebulon Rd Forsyth, GA 31029
Estimated Value: $174,911 - $255,000
2
Beds
1
Bath
720
Sq Ft
$285/Sq Ft
Est. Value
About This Home
This home is located at 60 Old Zebulon Rd, Forsyth, GA 31029 and is currently estimated at $205,478, approximately $285 per square foot. 60 Old Zebulon Rd is a home located in Monroe County with nearby schools including Samuel E. Hubbard Elementary School and Mary Persons High School.
Ownership History
Date
Name
Owned For
Owner Type
Purchase Details
Closed on
Oct 12, 2001
Current Estimated Value
Create a Home Valuation Report for This Property
The Home Valuation Report is an in-depth analysis detailing your home's value as well as a comparison with similar homes in the area
Home Values in the Area
Average Home Value in this Area
Purchase History
| Date | Buyer | Sale Price | Title Company |
|---|---|---|---|
| -- | -- | -- |
Source: Public Records
Tax History Compared to Growth
Tax History
| Year | Tax Paid | Tax Assessment Tax Assessment Total Assessment is a certain percentage of the fair market value that is determined by local assessors to be the total taxable value of land and additions on the property. | Land | Improvement |
|---|---|---|---|---|
| 2024 | $857 | $42,452 | $14,720 | $27,732 |
| 2023 | $235 | $38,332 | $14,720 | $23,612 |
| 2022 | $470 | $29,372 | $9,200 | $20,172 |
| 2021 | $487 | $29,372 | $9,200 | $20,172 |
| 2020 | $499 | $29,372 | $9,200 | $20,172 |
| 2019 | $503 | $29,372 | $9,200 | $20,172 |
| 2018 | $505 | $29,372 | $9,200 | $20,172 |
| 2017 | $801 | $27,572 | $9,200 | $18,372 |
| 2016 | $430 | $27,572 | $9,200 | $18,372 |
| 2015 | $408 | $27,572 | $9,200 | $18,372 |
| 2014 | $395 | $27,572 | $9,200 | $18,372 |
Source: Public Records
Map
Nearby Homes
- 0 Old Zebulon Rd Unit 25091896
- 0 Old Zebulon Rd Unit 25062362
- 0 Old Zebulon Rd Unit 25091897
- 4866 Hwy 42 S
- 519 Barbara Ct
- 271 Presidents Way
- 3319 Highway 42 S
- 266 Presidents Way
- 1774 Maynards Mill Rd
- 0 Yellow Creek Rd Unit 24433636
- 0 Yellow Creek Rd Unit 24433638
- 0 S Tingle Rd
- 0 Abercrombie Rd Unit 24572833
- 5588 Ga Highway 42 S Unit LOT 3
- TRACT A Russellville Rd
- TRACT B Russellville Rd
- 0 Rogers Church Rd Unit 10643854
- 1721 Old Zebulon Rd
- 1395 Josey Rd
- LOT 13 Creekside Ln
- 34 Old Zebulon Rd
- 3955 Ga Highway 42 S
- 0 Charles Johnson Rd Unit 11D 3177505
- 0 Charles Johnson Rd Unit 10D 3177502
- 0 Charles Johnson Rd Unit 12D 3177527
- 0 Charles Johnson Rd Unit K 7119127
- 0 Charles Johnson Rd Unit J 7119124
- 0 Charles Johnson Rd Unit I 7119117
- 0 Charles Johnson Rd Unit H 7119097
- 0 Charles Johnson Rd Unit G 7119089
- 0 Charles Johnson Rd Unit K 7219767
- 0 Charles Johnson Rd Unit J 7219765
- 0 Charles Johnson Rd Unit I 7219760
- 0 Charles Johnson Rd Unit 20150943
- 0 Charles Johnson Rd Unit 127534
- 0 Charles Johnson Rd Unit H 7219747
- 0 Charles Johnson Rd Unit G 7219746
- 0 Charles Johnson Rd Unit 9018609
- 0 Charles Johnson Rd Unit 8497914
- 0 Old Zebulon Rd Unit 3171335