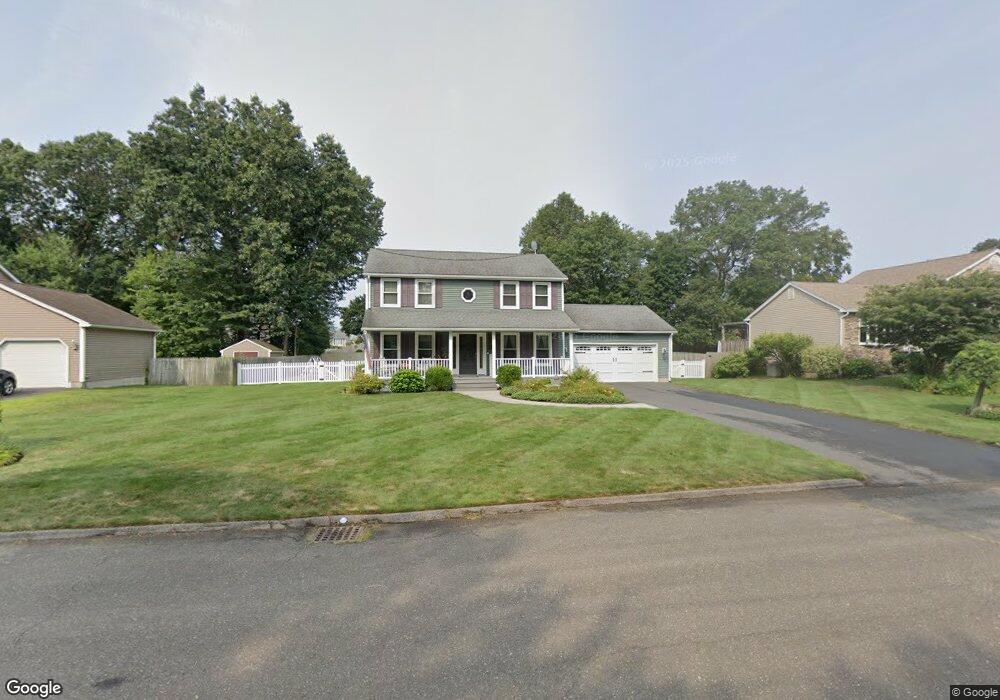
60 Post Rd Chicopee, MA 01020
Burnett Road NeighborhoodEstimated Value: $423,000 - $515,000
3
Beds
2
Baths
1,664
Sq Ft
$275/Sq Ft
Est. Value
About This Home
This home is located at 60 Post Rd, Chicopee, MA 01020 and is currently estimated at $457,455, approximately $274 per square foot. 60 Post Rd is a home located in Hampden County with nearby schools including Litwin Elementary School, Bellamy Middle School, and Chicopee High School.
Ownership History
Date
Name
Owned For
Owner Type
Purchase Details
Closed on
Dec 18, 2024
Sold by
Lebel Alan R and Lebel Claire M
Bought by
Lebel Jason and Dupre Erica
Current Estimated Value
Purchase Details
Closed on
Oct 25, 1989
Sold by
Anber Dev Corp
Bought by
Lebel Alan R
Create a Home Valuation Report for This Property
The Home Valuation Report is an in-depth analysis detailing your home's value as well as a comparison with similar homes in the area
Home Values in the Area
Average Home Value in this Area
Purchase History
| Date | Buyer | Sale Price | Title Company |
|---|---|---|---|
| Lebel Jason | -- | None Available | |
| Lebel Jason | -- | None Available | |
| Lebel Alan R | $178,500 | -- |
Source: Public Records
Mortgage History
| Date | Status | Borrower | Loan Amount |
|---|---|---|---|
| Previous Owner | Lebel Alan R | $100,802 | |
| Previous Owner | Lebel Alan R | $40,000 | |
| Previous Owner | Lebel Alan R | $134,000 | |
| Previous Owner | Lebel Alan R | $14,500 |
Source: Public Records
Tax History
| Year | Tax Paid | Tax Assessment Tax Assessment Total Assessment is a certain percentage of the fair market value that is determined by local assessors to be the total taxable value of land and additions on the property. | Land | Improvement |
|---|---|---|---|---|
| 2025 | $6,078 | $400,900 | $134,900 | $266,000 |
| 2024 | $5,759 | $390,200 | $132,200 | $258,000 |
| 2023 | $5,392 | $355,900 | $120,300 | $235,600 |
| 2022 | $5,221 | $307,300 | $104,500 | $202,800 |
| 2021 | $5,190 | $294,700 | $95,000 | $199,700 |
| 2020 | $4,920 | $281,800 | $95,000 | $186,800 |
| 2019 | $4,829 | $268,900 | $95,000 | $173,900 |
| 2018 | $4,665 | $254,800 | $90,500 | $164,300 |
| 2017 | $4,279 | $247,200 | $85,100 | $162,100 |
| 2016 | $4,111 | $243,100 | $85,100 | $158,000 |
| 2015 | $4,175 | $238,000 | $85,100 | $152,900 |
| 2014 | $2,087 | $238,000 | $85,100 | $152,900 |
Source: Public Records
Map
Nearby Homes
- 15 Hilltop Terrace
- 42 Roy St
- 83 Loomis Dr
- 12 Mariana Way
- 482 Holyoke St
- 350 West St Unit 3
- 350 West St Unit 19
- 350 West St Unit 17
- 16 Sesame Dr
- 59 Prospect Gardens
- 28 Mockingbird Dr
- 47 Kendall St
- 382 Holyoke St
- Lot 602 Grandview Ave
- 1045-1047 Worcester St
- 166-168 Main St
- 57 Belmont St
- 115 Hampden St
- 201 Main St
- 295 Main St
Your Personal Tour Guide
Ask me questions while you tour the home.