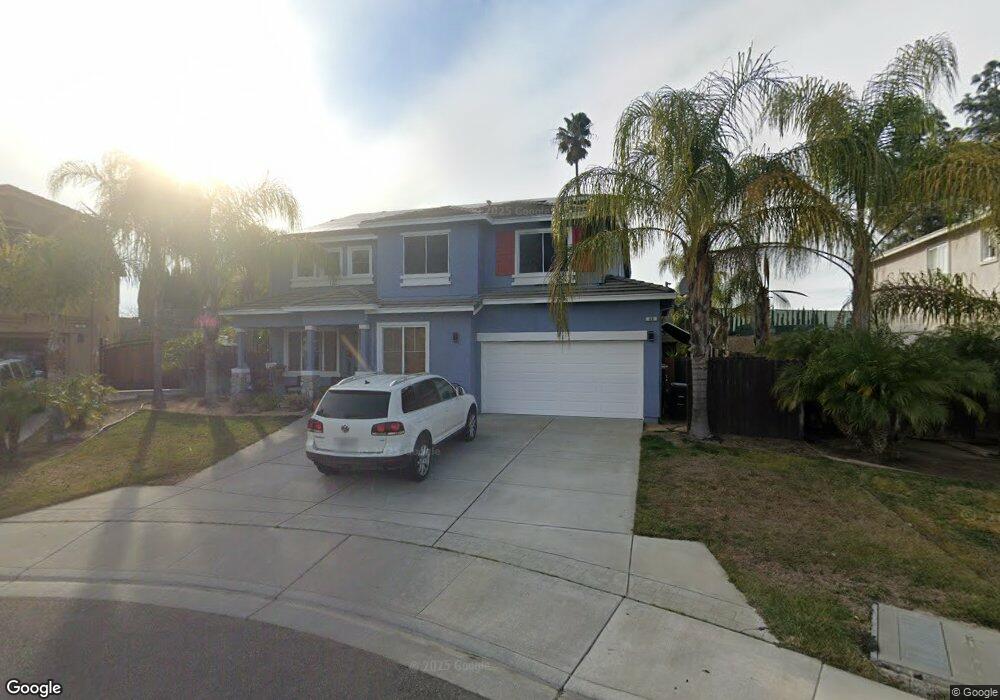
60 Ridge Crest Ct Oakley, CA 94561
South Oakley NeighborhoodEstimated Value: $762,000 - $844,000
4
Beds
3
Baths
2,598
Sq Ft
$309/Sq Ft
Est. Value
About This Home
This home is located at 60 Ridge Crest Ct, Oakley, CA 94561 and is currently estimated at $802,118, approximately $308 per square foot. 60 Ridge Crest Ct is a home located in Contra Costa County with nearby schools including Almond Grove Elementary School, O'Hara Park Middle School, and Freedom High School.
Ownership History
Date
Name
Owned For
Owner Type
Purchase Details
Closed on
Feb 1, 2024
Sold by
St Clair Edward C & Casie L
Bought by
2024 St Clair Family Trust and St Clair
Current Estimated Value
Purchase Details
Closed on
Feb 21, 2014
Sold by
St Clair Casie L and Hilsenbeck Casie L
Bought by
St Clair Edward C and St Clair Casie L
Home Financials for this Owner
Home Financials are based on the most recent Mortgage that was taken out on this home.
Original Mortgage
$282,000
Interest Rate
4.38%
Mortgage Type
New Conventional
Purchase Details
Closed on
Sep 1, 2008
Sold by
Hsbc Bank Usa Na
Bought by
Hilsenbeck Casie L
Home Financials for this Owner
Home Financials are based on the most recent Mortgage that was taken out on this home.
Original Mortgage
$305,210
Interest Rate
6.51%
Mortgage Type
FHA
Purchase Details
Closed on
May 2, 2008
Sold by
Cornell Polly
Bought by
Hsbc Bank Usa Na
Purchase Details
Closed on
Mar 7, 2007
Sold by
Discovery Builders Inc
Bought by
Cornell Polly
Home Financials for this Owner
Home Financials are based on the most recent Mortgage that was taken out on this home.
Original Mortgage
$512,428
Interest Rate
6.29%
Mortgage Type
Purchase Money Mortgage
Create a Home Valuation Report for This Property
The Home Valuation Report is an in-depth analysis detailing your home's value as well as a comparison with similar homes in the area
Home Values in the Area
Average Home Value in this Area
Purchase History
| Date | Buyer | Sale Price | Title Company |
|---|---|---|---|
| 2024 St Clair Family Trust | -- | None Listed On Document | |
| St Clair Edward C | -- | First American Title Company | |
| Hilsenbeck Casie L | $310,000 | First American Title Company | |
| Hsbc Bank Usa Na | $348,750 | Accommodation | |
| Cornell Polly | $641,000 | Old Republic Title Company |
Source: Public Records
Mortgage History
| Date | Status | Borrower | Loan Amount |
|---|---|---|---|
| Previous Owner | St Clair Edward C | $282,000 | |
| Previous Owner | Hilsenbeck Casie L | $305,210 | |
| Previous Owner | Cornell Polly | $512,428 |
Source: Public Records
Tax History Compared to Growth
Tax History
| Year | Tax Paid | Tax Assessment Tax Assessment Total Assessment is a certain percentage of the fair market value that is determined by local assessors to be the total taxable value of land and additions on the property. | Land | Improvement |
|---|---|---|---|---|
| 2025 | $7,914 | $425,004 | $64,379 | $360,625 |
| 2024 | $7,779 | $416,671 | $63,117 | $353,554 |
| 2023 | $7,779 | $408,502 | $61,880 | $346,622 |
| 2022 | $7,633 | $400,493 | $60,667 | $339,826 |
| 2021 | $7,440 | $392,641 | $59,478 | $333,163 |
| 2019 | $7,079 | $380,997 | $57,715 | $323,282 |
| 2018 | $6,873 | $373,528 | $56,584 | $316,944 |
| 2017 | $6,767 | $366,205 | $55,475 | $310,730 |
| 2016 | $6,436 | $359,026 | $54,388 | $304,638 |
| 2015 | $6,417 | $353,635 | $53,572 | $300,063 |
| 2014 | $6,257 | $346,709 | $52,523 | $294,186 |
Source: Public Records
Map
Nearby Homes
- 297 Eagle Nest Dr
- 21 Foxglove Ct
- 515 Longhorn Way
- 504 Silver Spur Ln
- 43 Sorrel Ct
- The Dumont Plan at The Preserve at Stonewood - The Preserve at Stone Wood
- The Baxter Plan at The Preserve at Stonewood - The Preserve at Stone Wood
- The Carlton Plan at The Preserve at Stonewood - The Preserve at Stone Wood
- The Amber Plan at The Preserve at Stonewood - The Preserve at Stone Wood
- 31 Rustic Ct
- 322 Barn Dance Way
- 520 Stone Mountain Dr
- 2856 Gardenside Ct
- 876 Diamante Way
- 2986 Atherton Place
- 239 Sterling Way
- 1148 Breton Dr
- 1040 Morning Glory Way
- 2828 Pristine Way
- 3901-B Rose Ave
- 70 Ridge Crest Ct
- 50 Ridge Crest Ct
- 902 Carpenter Rd
- 80 Ridge Crest Ct
- 40 Ridge Crest Ct
- 20 Ridge Crest Ct
- 30 Ridge Crest Ct
- 10 Ridge Crest Ct
- 90 Ridge Crest Ct
- 237 Eagle Nest Dr
- 100 Ridge Crest Ct
- 170 Ridge Crest Ct
- 233 Eagle Nest Dr
- 160 Ridge Crest Ct
- 1904 Cinnamon Ridge Dr
- 1908 Cinnamon Ridge Dr
- 1900 Cinnamon Ridge Dr
- 1912 Cinnamon Ridge Dr
- 110 Ridge Crest Ct
- 1916 Cinnamon Ridge Dr