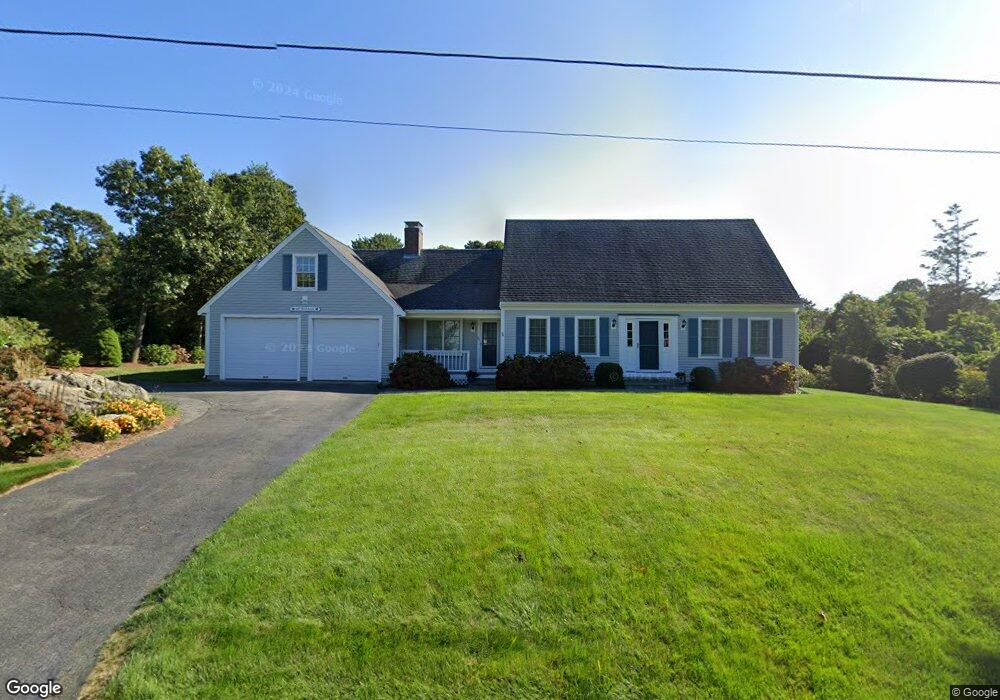
60 Robbins Cir Dennis, MA 02638
Dennis Village NeighborhoodEstimated Value: $1,204,000 - $1,504,000
4
Beds
3
Baths
1,918
Sq Ft
$710/Sq Ft
Est. Value
About This Home
This home is located at 60 Robbins Cir, Dennis, MA 02638 and is currently estimated at $1,360,995, approximately $709 per square foot. 60 Robbins Cir is a home located in Barnstable County with nearby schools including Dennis-Yarmouth Regional High School.
Ownership History
Date
Name
Owned For
Owner Type
Purchase Details
Closed on
Nov 2, 2022
Sold by
Thompson Donald F and Thompson Joan M
Bought by
Thompson Nt
Current Estimated Value
Purchase Details
Closed on
Dec 3, 2010
Sold by
Tremblay Albert J and Tremblay Jeanne M
Bought by
Thompson Donald F
Home Financials for this Owner
Home Financials are based on the most recent Mortgage that was taken out on this home.
Original Mortgage
$300,000
Interest Rate
4.22%
Mortgage Type
Purchase Money Mortgage
Purchase Details
Closed on
May 11, 1994
Sold by
Sheahan James E and Sheahan Audrey G
Bought by
Tremblay Albert J
Home Financials for this Owner
Home Financials are based on the most recent Mortgage that was taken out on this home.
Original Mortgage
$171,000
Interest Rate
7.93%
Mortgage Type
Purchase Money Mortgage
Create a Home Valuation Report for This Property
The Home Valuation Report is an in-depth analysis detailing your home's value as well as a comparison with similar homes in the area
Home Values in the Area
Average Home Value in this Area
Purchase History
| Date | Buyer | Sale Price | Title Company |
|---|---|---|---|
| Thompson Nt | -- | None Available | |
| Thompson Donald F | $700,000 | -- | |
| Tremblay Albert J | $75,000 | -- |
Source: Public Records
Mortgage History
| Date | Status | Borrower | Loan Amount |
|---|---|---|---|
| Previous Owner | Thompson Donald F | $300,000 | |
| Previous Owner | Tremblay Albert J | $23,000 | |
| Previous Owner | Tremblay Albert J | $171,000 |
Source: Public Records
Tax History Compared to Growth
Tax History
| Year | Tax Paid | Tax Assessment Tax Assessment Total Assessment is a certain percentage of the fair market value that is determined by local assessors to be the total taxable value of land and additions on the property. | Land | Improvement |
|---|---|---|---|---|
| 2025 | $4,873 | $1,125,500 | $472,700 | $652,800 |
| 2024 | $4,791 | $1,091,300 | $454,600 | $636,700 |
| 2023 | $4,634 | $992,300 | $413,300 | $579,000 |
| 2022 | $4,525 | $808,100 | $372,300 | $435,800 |
| 2021 | $4,287 | $711,000 | $365,000 | $346,000 |
| 2020 | $4,906 | $804,300 | $408,800 | $395,500 |
| 2019 | $4,386 | $710,800 | $357,800 | $353,000 |
| 2018 | $4,296 | $677,600 | $340,600 | $337,000 |
| 2017 | $4,167 | $677,600 | $340,600 | $337,000 |
| 2016 | $4,098 | $627,600 | $340,600 | $287,000 |
| 2015 | $3,788 | $591,900 | $340,600 | $251,300 |
| 2014 | $3,190 | $502,300 | $258,900 | $243,400 |
Source: Public Records
Map
Nearby Homes
- 19 Whig St
- 37 Johnson Ln
- 7 Dolphin Way
- 25 Horsefoot Path
- 73 Pilgrim Rd
- 12 Dunes View Rd
- 96 Shore Dr
- 645 Main St Back Lot
- 19 Deacon Joseph Ln
- 59 Hope Ln
- 156 Shore Dr
- 69 Horsefoot Path
- 15 Signal Hill Dr
- 6 Thomas Ct
- 49 Rodoalph's Way
- 94 Horsefoot Path
- 7 Collins Ave
- 35 Crown Grant Dr
- 4 Spadoni Rd
- 4 Spadoni Way