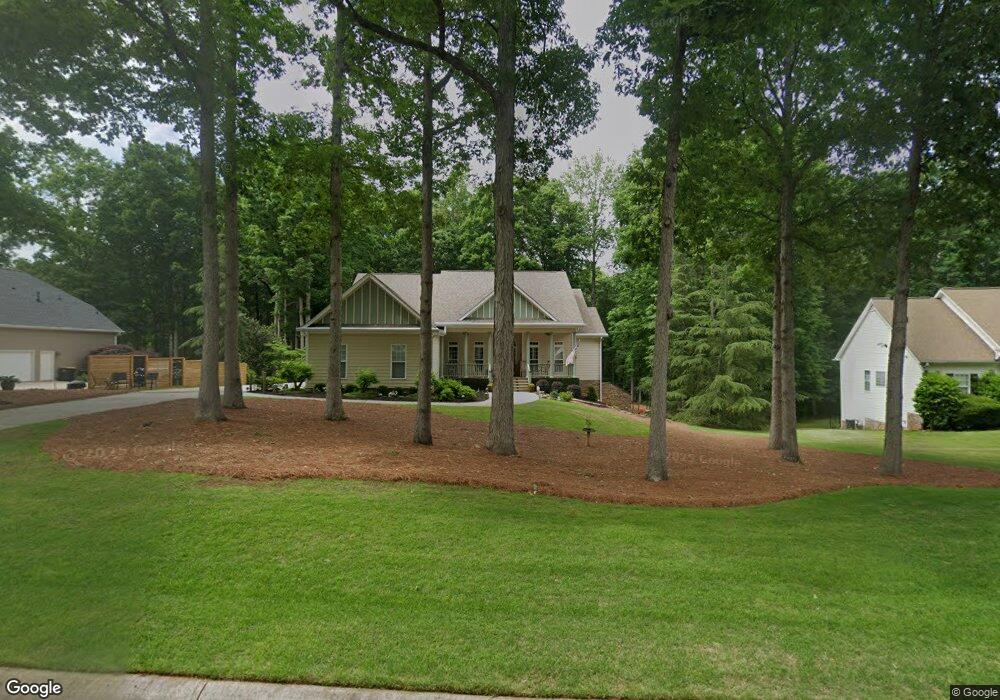
60 Ryans Ct Unit D Sharpsburg, GA 30277
Estimated Value: $615,000 - $740,000
5
Beds
5
Baths
4,486
Sq Ft
$152/Sq Ft
Est. Value
About This Home
This home is located at 60 Ryans Ct Unit D, Sharpsburg, GA 30277 and is currently estimated at $682,403, approximately $152 per square foot. 60 Ryans Ct Unit D is a home located in Coweta County with nearby schools including Canongate Elementary School, Lee Middle School, and Northgate High School.
Ownership History
Date
Name
Owned For
Owner Type
Purchase Details
Closed on
Jul 15, 2011
Sold by
Crenshaw Gordon G and Crenshaw Cricket C
Bought by
Young Barry A and Young Roselle B
Current Estimated Value
Purchase Details
Closed on
Jul 31, 2002
Sold by
Weststar Builders & Dev Inc
Bought by
Crenshae Goreon G and Crenshae Cricket C
Home Financials for this Owner
Home Financials are based on the most recent Mortgage that was taken out on this home.
Original Mortgage
$210,795
Interest Rate
6.62%
Mortgage Type
New Conventional
Purchase Details
Closed on
Jul 10, 2001
Sold by
Reese Builders & Developers In
Bought by
Weststar Builders & Developers Inc
Purchase Details
Closed on
May 2, 1995
Sold by
Bell Larmar A and Bell Esth
Bought by
Reese Builders & Developers Inc
Create a Home Valuation Report for This Property
The Home Valuation Report is an in-depth analysis detailing your home's value as well as a comparison with similar homes in the area
Home Values in the Area
Average Home Value in this Area
Purchase History
| Date | Buyer | Sale Price | Title Company |
|---|---|---|---|
| Young Barry A | $281,000 | -- | |
| Crenshae Goreon G | $263,500 | -- | |
| Weststar Builders & Developers Inc | $466,700 | -- | |
| Reese Builders & Developers Inc | $1,120,800 | -- |
Source: Public Records
Mortgage History
| Date | Status | Borrower | Loan Amount |
|---|---|---|---|
| Previous Owner | Crenshae Goreon G | $210,795 |
Source: Public Records
Tax History Compared to Growth
Tax History
| Year | Tax Paid | Tax Assessment Tax Assessment Total Assessment is a certain percentage of the fair market value that is determined by local assessors to be the total taxable value of land and additions on the property. | Land | Improvement |
|---|---|---|---|---|
| 2025 | $4,925 | $251,344 | $32,000 | $219,344 |
| 2024 | $4,754 | $247,874 | $32,000 | $215,874 |
| 2023 | $4,754 | $214,586 | $26,000 | $188,586 |
| 2022 | $3,692 | $192,229 | $26,000 | $166,229 |
| 2021 | $3,598 | $179,121 | $20,000 | $159,121 |
| 2020 | $3,619 | $179,121 | $20,000 | $159,121 |
| 2019 | $4,183 | $147,711 | $22,000 | $125,711 |
| 2018 | $4,191 | $147,711 | $22,000 | $125,711 |
| 2017 | $4,189 | $147,711 | $22,000 | $125,711 |
| 2016 | $3,430 | $123,152 | $22,000 | $101,152 |
| 2015 | $3,375 | $123,152 | $22,000 | $101,152 |
| 2014 | $2,587 | $115,754 | $17,600 | $98,154 |
Source: Public Records
Map
Nearby Homes
- 125 Cannongate Cir
- 2043 Fischer Rd
- 2039 Fischer Rd
- 131 Cannongate Cir
- 12 Race Point Way
- 10 Fisher Way
- 75 Tomahawk Dr
- 68 Timbercreek Estates Dr
- 95 Tyler Woods Dr
- 0 Maple Trail
- 319 Le Paradis Blvd
- 259 Strathmore Dr Unit 3
- 972 Raymond Hill Rd
- 75 Kripple Kreek Dr
- 851 Raymond Hill Rd
- 136 Barrington Grange Dr
- 121 Northwoods Rd
- 10 Monteray Ct
- 200 Barrington Grange Dr
- 10 Queens Ct
- 50 Ryans Ct Unit D
- 70 Ryans Ct
- 40 Ryans Ct
- 80 Ryans Ct
- 65 Ryans Ct
- 55 Ryans Ct
- 45 Ryans Ct
- 30 Ryans Ct
- 90 Ryans Ct
- 85 Ryans Ct
- 100 Ryans Ct
- 20 Ryans Ct Unit W
- 25 Ryans Ct
- 110 Ryans Ct
- 110 Hamstead Park Dr
- 244 Beverly Farms Dr
- 120 Hamstead Park Dr
- 10 Ryans Ct
- 175 Hamstead Park Dr
- 292 Beverly Farms Dr