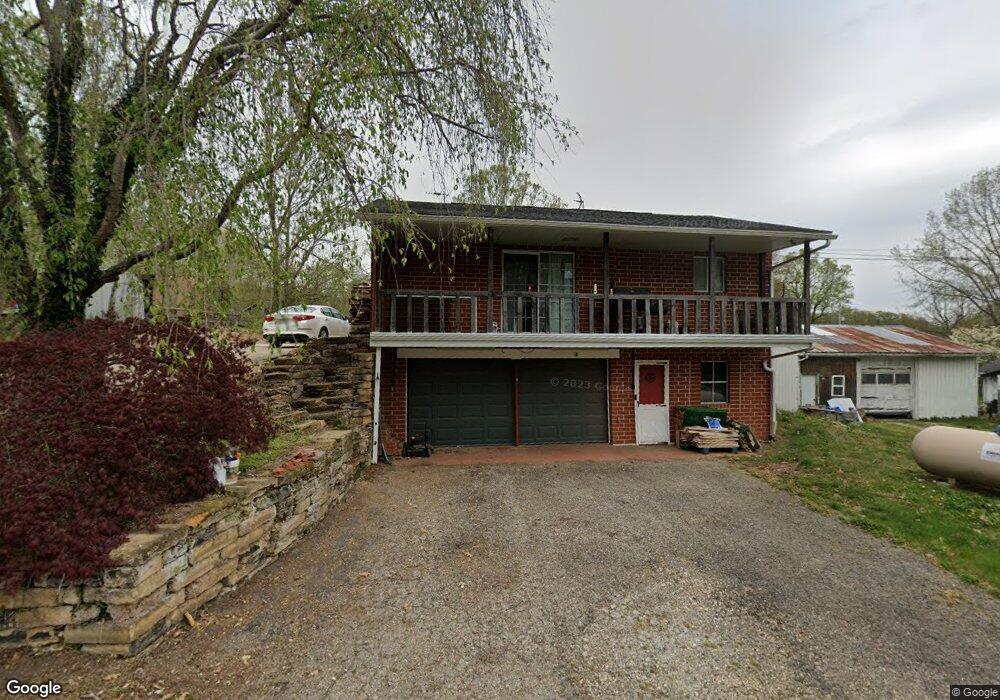
60 Sinalda Ave Newark, OH 43055
Estimated Value: $178,898 - $273,000
2
Beds
1
Bath
952
Sq Ft
$216/Sq Ft
Est. Value
About This Home
This home is located at 60 Sinalda Ave, Newark, OH 43055 and is currently estimated at $205,475, approximately $215 per square foot. 60 Sinalda Ave is a home located in Licking County with nearby schools including Licking Valley Elementary School, Licking Valley Middle School, and Licking Valley High School.
Ownership History
Date
Name
Owned For
Owner Type
Purchase Details
Closed on
Feb 24, 2022
Sold by
Brandt Lawrence A
Bought by
Lovell Jessica M and Lovell Dominic L
Current Estimated Value
Home Financials for this Owner
Home Financials are based on the most recent Mortgage that was taken out on this home.
Original Mortgage
$137,365
Outstanding Balance
$128,300
Interest Rate
3.89%
Mortgage Type
FHA
Estimated Equity
$77,175
Purchase Details
Closed on
Jul 30, 2021
Sold by
Barber Justin L and Jewell Jessica M
Bought by
Brandt Lawrence A
Purchase Details
Closed on
Jul 28, 2017
Sold by
Hanby Kaden
Bought by
Farmer Jason
Home Financials for this Owner
Home Financials are based on the most recent Mortgage that was taken out on this home.
Original Mortgage
$28,800
Interest Rate
3.78%
Purchase Details
Closed on
Apr 13, 2012
Sold by
Farmer Verlin T and Farmer Verlen T
Bought by
Hanby Kaden P
Purchase Details
Closed on
Sep 8, 2003
Sold by
Farmer Joyce M and Farmer Verlin T
Bought by
Farmer Verlin T
Create a Home Valuation Report for This Property
The Home Valuation Report is an in-depth analysis detailing your home's value as well as a comparison with similar homes in the area
Home Values in the Area
Average Home Value in this Area
Purchase History
| Date | Buyer | Sale Price | Title Company |
|---|---|---|---|
| Lovell Jessica M | $140,000 | Magnuson & Barone | |
| Brandt Lawrence A | $105,000 | Valmer Land Title Agency | |
| Farmer Jason | -- | None Available | |
| Hanby Kaden P | $13,800 | None Available | |
| Farmer Verlin T | -- | -- |
Source: Public Records
Mortgage History
| Date | Status | Borrower | Loan Amount |
|---|---|---|---|
| Open | Lovell Jessica M | $137,365 | |
| Previous Owner | Farmer Jason | $28,800 |
Source: Public Records
Tax History Compared to Growth
Tax History
| Year | Tax Paid | Tax Assessment Tax Assessment Total Assessment is a certain percentage of the fair market value that is determined by local assessors to be the total taxable value of land and additions on the property. | Land | Improvement |
|---|---|---|---|---|
| 2024 | $1,524 | $46,550 | $4,900 | $41,650 |
| 2023 | $1,555 | $46,550 | $4,900 | $41,650 |
| 2022 | $1,200 | $32,410 | $2,660 | $29,750 |
| 2021 | $1,224 | $32,410 | $2,660 | $29,750 |
| 2020 | $1,164 | $30,940 | $1,190 | $29,750 |
| 2019 | $1,046 | $25,760 | $980 | $24,780 |
| 2018 | $704 | $0 | $0 | $0 |
| 2017 | $577 | $0 | $0 | $0 |
| 2016 | $450 | $0 | $0 | $0 |
| 2015 | $448 | $0 | $0 | $0 |
| 2014 | $1,101 | $0 | $0 | $0 |
| 2013 | $446 | $0 | $0 | $0 |
Source: Public Records
Map
Nearby Homes
- 52 Third St SE
- 2476 Gratiot Rd SE
- 18132 Claypool Rd SE
- 16604 Texas Rd SE
- 18988 Claypool Rd
- 10315 Marne Rd
- 10345 Marne Rd
- 1698 Seven Hills Rd NE Unit Tract C
- 1698 Seven Hills Rd NE Unit Tract B
- 17930 Bear Rd
- 2378 W High St
- 2378 W High St NE
- 193 New Home Dr NE
- 0 W High St NE
- 9945 Newark Rd
- 0 Briarcliff Rd Unit LotWP001
- 19121 Marne Rd
- 719 Colby Way NE
- 0 Waldeck Dr Unit 68 24314733
- 0 Waldeck Dr Unit Lot 70 224039875