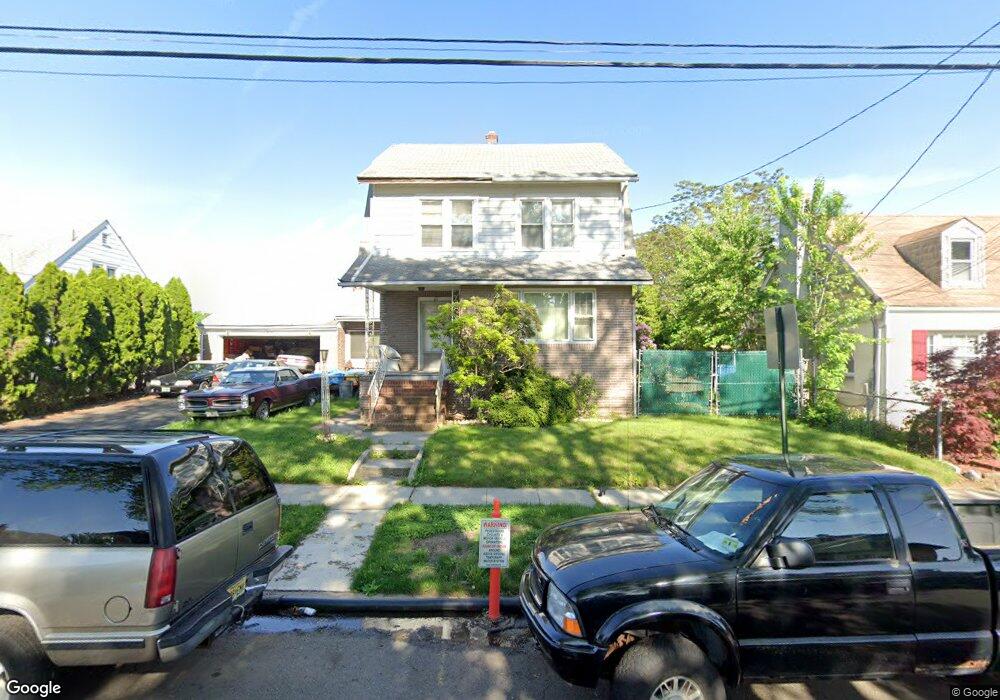
60 Spring St Bloomfield, NJ 07003
Estimated Value: $541,000 - $605,000
Studio
--
Bath
1,892
Sq Ft
$303/Sq Ft
Est. Value
About This Home
This home is located at 60 Spring St, Bloomfield, NJ 07003 and is currently estimated at $574,179, approximately $303 per square foot. 60 Spring St is a home located in Essex County with nearby schools including Franklin School, Bloomfield Middle School, and Bloomfield High School.
Ownership History
Date
Name
Owned For
Owner Type
Purchase Details
Closed on
Apr 18, 2025
Sold by
Santiago Jose R
Bought by
58Sixty Llc
Current Estimated Value
Home Financials for this Owner
Home Financials are based on the most recent Mortgage that was taken out on this home.
Original Mortgage
$454,455
Outstanding Balance
$268,289
Interest Rate
5.8%
Mortgage Type
Construction
Estimated Equity
$305,890
Purchase Details
Closed on
Jun 15, 2023
Sold by
Ballester Omaira
Bought by
Santiago Jose R
Purchase Details
Closed on
Jun 2, 2023
Sold by
Saltarelli Gary M
Bought by
Redacted Upon Request
Purchase Details
Closed on
Mar 30, 2000
Create a Home Valuation Report for This Property
The Home Valuation Report is an in-depth analysis detailing your home's value as well as a comparison with similar homes in the area
Home Values in the Area
Average Home Value in this Area
Purchase History
| Date | Buyer | Sale Price | Title Company |
|---|---|---|---|
| 58Sixty Llc | -- | Clear Skies Title | |
| Santiago Jose R | -- | None Listed On Document | |
| Redacted Upon Request | $282,000 | Old Republic National Title | |
| -- | $150,000 | -- |
Source: Public Records
Mortgage History
| Date | Status | Borrower | Loan Amount |
|---|---|---|---|
| Open | 58Sixty Llc | $454,455 |
Source: Public Records
Tax History
| Year | Tax Paid | Tax Assessment Tax Assessment Total Assessment is a certain percentage of the fair market value that is determined by local assessors to be the total taxable value of land and additions on the property. | Land | Improvement |
|---|---|---|---|---|
| 2025 | $14,162 | $417,500 | $128,900 | $288,600 |
| 2024 | $13,644 | $417,500 | $128,900 | $288,600 |
| 2022 | $13,368 | $417,500 | $128,900 | $288,600 |
| 2021 | $13,122 | $417,500 | $128,900 | $288,600 |
| 2020 | $12,922 | $417,500 | $128,900 | $288,600 |
| 2019 | $12,795 | $321,400 | $131,100 | $190,300 |
| 2018 | $12,740 | $321,400 | $131,100 | $190,300 |
| 2017 | $12,547 | $321,400 | $131,100 | $190,300 |
| 2016 | $12,406 | $321,400 | $131,100 | $190,300 |
| 2015 | $12,294 | $321,400 | $131,100 | $190,300 |
| 2014 | $12,069 | $321,400 | $131,100 | $190,300 |
Source: Public Records
Map
Nearby Homes
- 7 Maple St
- 10 Almira St Unit 14
- 10 14almira St
- 10 E Passaic Ave
- 46 Maple St
- 46 Summit Ave
- 28 Forest Dr
- 39 Forest Dr
- 41 Woodland Rd
- 39 Woodland Rd
- 378 Hoover Ave Unit 149
- 58 Osborne St
- 152 Belleville Ave Unit 1
- 366 Hoover Ave Unit 119
- 185 State St
- 82 Essex Ave
- 5 Woodland Rd
- 186 Walnut St Unit 114
- 115 Spruce St
- 169 Walnut St
- 54 Spring St
- 62 Spring St
- 50 Spring St
- 46 Spring St
- 57 Spring St
- 42 Spring St
- 47 Spring St
- 27 Division St
- 31 Division St
- 35 Division St
- 14 Division St
- 14 Division St Unit 1
- 53 Spring St
- 51 Spring St
- 61 Spring St Unit 3
- 61 Spring St Unit center
- 61 Spring St
- 39 Division St
- 39 Division St Unit 2
- 43 Spring St
Your Personal Tour Guide
Ask me questions while you tour the home.