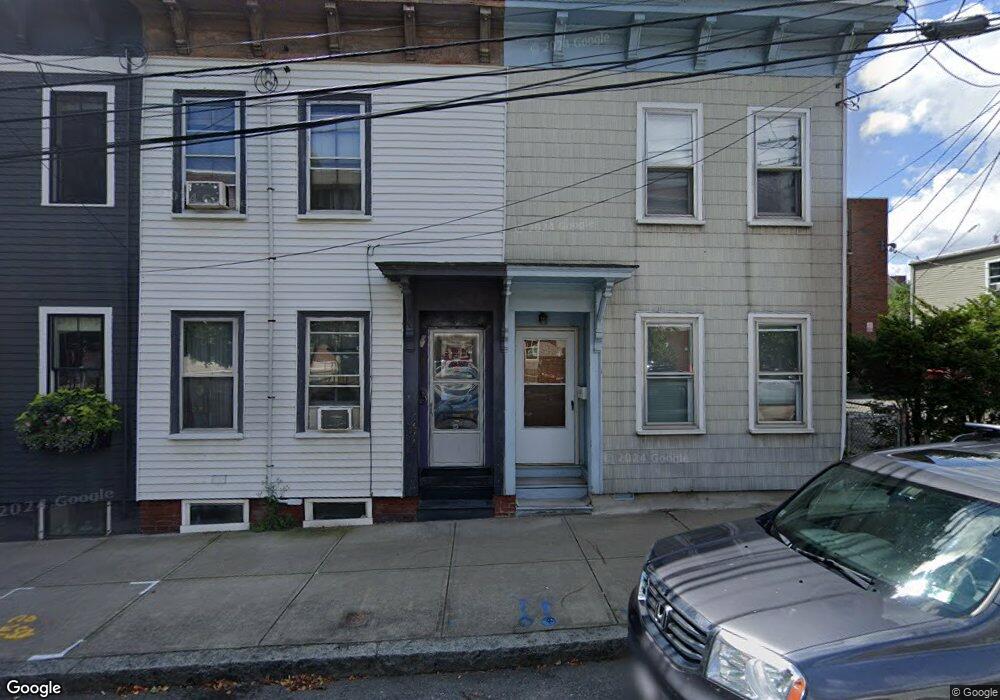
60 Spring St Cambridge, MA 02141
East Cambridge NeighborhoodEstimated Value: $809,000 - $1,141,000
3
Beds
2
Baths
1,204
Sq Ft
$822/Sq Ft
Est. Value
About This Home
This home is located at 60 Spring St, Cambridge, MA 02141 and is currently estimated at $989,592, approximately $821 per square foot. 60 Spring St is a home located in Middlesex County with nearby schools including Prospect Hill Academy Charter School, Community Charter School of Cambridge, and Torit Montessori School.
Ownership History
Date
Name
Owned For
Owner Type
Purchase Details
Closed on
Aug 26, 1997
Sold by
Costa Linda M and Costa Jeanne M
Bought by
Wu Zhong-Xiang and Zhang Lihua
Current Estimated Value
Home Financials for this Owner
Home Financials are based on the most recent Mortgage that was taken out on this home.
Original Mortgage
$89,000
Outstanding Balance
$13,732
Interest Rate
7.42%
Mortgage Type
Purchase Money Mortgage
Estimated Equity
$975,860
Create a Home Valuation Report for This Property
The Home Valuation Report is an in-depth analysis detailing your home's value as well as a comparison with similar homes in the area
Home Values in the Area
Average Home Value in this Area
Purchase History
| Date | Buyer | Sale Price | Title Company |
|---|---|---|---|
| Wu Zhong-Xiang | $139,000 | -- | |
| Wu Zhong-Xiang | $139,000 | -- |
Source: Public Records
Mortgage History
| Date | Status | Borrower | Loan Amount |
|---|---|---|---|
| Open | Wu Zhong-Xiang | $89,000 | |
| Closed | Wu Zhong-Xiang | $89,000 |
Source: Public Records
Tax History
| Year | Tax Paid | Tax Assessment Tax Assessment Total Assessment is a certain percentage of the fair market value that is determined by local assessors to be the total taxable value of land and additions on the property. | Land | Improvement |
|---|---|---|---|---|
| 2025 | $4,676 | $736,300 | $536,600 | $199,700 |
| 2024 | $4,460 | $753,300 | $582,700 | $170,600 |
| 2023 | $4,252 | $725,600 | $556,300 | $169,300 |
| 2022 | $4,264 | $720,300 | $572,400 | $147,900 |
| 2021 | $4,126 | $705,300 | $561,700 | $143,600 |
| 2020 | $4,071 | $708,000 | $567,000 | $141,000 |
| 2019 | $4,057 | $683,000 | $556,200 | $126,800 |
| 2018 | $3,662 | $582,200 | $461,200 | $121,000 |
| 2017 | $3,438 | $529,700 | $412,400 | $117,300 |
| 2016 | $3,053 | $436,700 | $322,800 | $113,900 |
| 2015 | $2,958 | $378,300 | $276,700 | $101,600 |
| 2014 | $2,636 | $314,500 | $214,300 | $100,200 |
Source: Public Records
Map
Nearby Homes
- 50 Spring St
- 76-78 Thorndike St
- 93 Third St
- 78 Otis St
- 259 Hurley St Unit 4
- 30 2nd St Unit B
- 30 2nd St Unit A
- 30
- 17 Otis St Unit 602
- 303 Hurley St
- 68 Gore St
- 169 Monsignor Obrien Hwy Unit 605
- 10 Rogers St Unit 606
- 10 Rogers St Unit 703
- 10 Rogers St Unit PH4
- 6 Canal Park Unit 602
- 6 Canal Park Unit 105
- 4 Canal Park Unit PH9
- 4 Canal Park Unit PH8
- 262 Monsignor Obrien Hwy Unit 503
- 60 Spring St Unit 3L
- 58 1/2 Spring St
- 58 Spring St
- 62 Spring St Unit 3L
- 62 Spring St Unit 2R
- 62 Spring St Unit 3R
- 62 Spring St
- 56 Spring St
- 56 Spring St
- 56 Spring St Unit 56
- 56 Spring St Unit 1
- 54 Spring St
- 54 Spring St Unit 1
- 145 3rd St
- 66 Spring St
- 66 Spring St Unit 1
- 66 Spring St Unit 62-2R
- 66 Spring St Unit 62-3L
- 66 Spring St Unit 3
- 66 Spring St
Your Personal Tour Guide
Ask me questions while you tour the home.