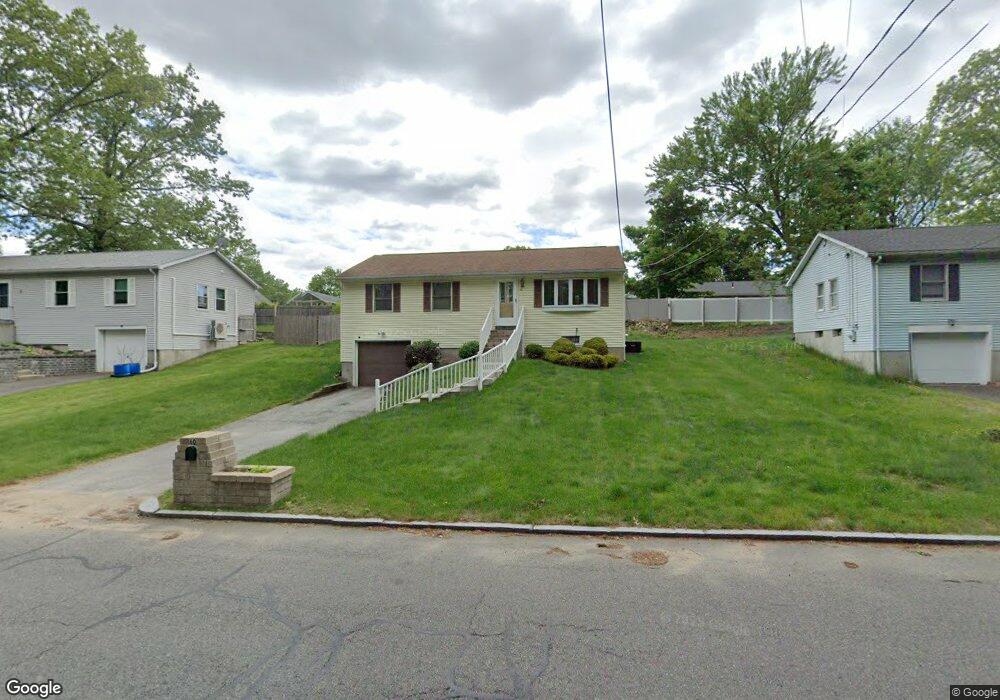
60 Walsh St Springfield, MA 01109
Sixteen Acres NeighborhoodEstimated Value: $258,000 - $346,000
3
Beds
1
Bath
1,008
Sq Ft
$296/Sq Ft
Est. Value
About This Home
This home is located at 60 Walsh St, Springfield, MA 01109 and is currently estimated at $298,537, approximately $296 per square foot. 60 Walsh St is a home located in Hampden County with nearby schools including Frank H. Freedman School, John J Duggan Middle, and Springfield High School of Science and Technology.
Ownership History
Date
Name
Owned For
Owner Type
Purchase Details
Closed on
May 21, 2021
Sold by
Nichols Maurice
Bought by
Nichols Maurice and Nichols Maurice D
Current Estimated Value
Home Financials for this Owner
Home Financials are based on the most recent Mortgage that was taken out on this home.
Original Mortgage
$127,000
Outstanding Balance
$114,481
Interest Rate
2.9%
Mortgage Type
New Conventional
Estimated Equity
$184,056
Purchase Details
Closed on
Jul 8, 1993
Sold by
Bousquet Paul A and Mazzella Richard J
Bought by
Nichols Maurice
Home Financials for this Owner
Home Financials are based on the most recent Mortgage that was taken out on this home.
Original Mortgage
$90,250
Interest Rate
7.43%
Mortgage Type
Purchase Money Mortgage
Create a Home Valuation Report for This Property
The Home Valuation Report is an in-depth analysis detailing your home's value as well as a comparison with similar homes in the area
Home Values in the Area
Average Home Value in this Area
Purchase History
| Date | Buyer | Sale Price | Title Company |
|---|---|---|---|
| Nichols Maurice | -- | None Available | |
| Nichols Maurice | -- | None Available | |
| Nichols Maurice | $95,000 | -- | |
| Nichols Maurice | $95,000 | -- |
Source: Public Records
Mortgage History
| Date | Status | Borrower | Loan Amount |
|---|---|---|---|
| Open | Nichols Maurice | $127,000 | |
| Closed | Nichols Maurice | $127,000 | |
| Previous Owner | Nichols Maurice | $90,250 |
Source: Public Records
Tax History
| Year | Tax Paid | Tax Assessment Tax Assessment Total Assessment is a certain percentage of the fair market value that is determined by local assessors to be the total taxable value of land and additions on the property. | Land | Improvement |
|---|---|---|---|---|
| 2025 | $4,133 | $263,600 | $51,400 | $212,200 |
| 2024 | $4,145 | $258,100 | $51,400 | $206,700 |
| 2023 | $4,112 | $241,200 | $49,000 | $192,200 |
| 2022 | $3,612 | $191,900 | $49,000 | $142,900 |
| 2021 | $3,459 | $183,000 | $44,500 | $138,500 |
| 2020 | $3,160 | $161,800 | $44,500 | $117,300 |
| 2019 | $3,190 | $162,100 | $44,500 | $117,600 |
| 2018 | $3,082 | $156,600 | $44,500 | $112,100 |
| 2017 | $3,047 | $155,000 | $49,300 | $105,700 |
| 2016 | $2,927 | $148,900 | $49,300 | $99,600 |
| 2015 | $2,876 | $146,200 | $49,300 | $96,900 |
Source: Public Records
Map
Nearby Homes
Your Personal Tour Guide
Ask me questions while you tour the home.