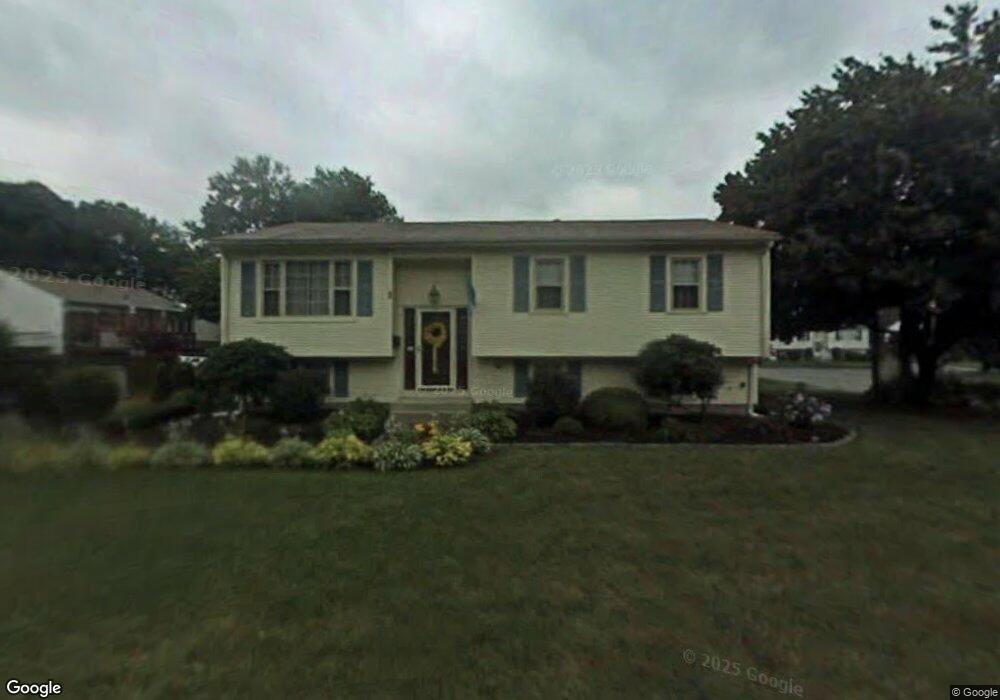
60 Winton St Cranston, RI 02910
Park View NeighborhoodEstimated Value: $429,000 - $490,000
3
Beds
2
Baths
2,256
Sq Ft
$202/Sq Ft
Est. Value
About This Home
This home is located at 60 Winton St, Cranston, RI 02910 and is currently estimated at $454,723, approximately $201 per square foot. 60 Winton St is a home located in Providence County with nearby schools including Edgewood Highland Elementary School, Edward S. Rhodes School, and Park View Middle School.
Ownership History
Date
Name
Owned For
Owner Type
Purchase Details
Closed on
Sep 7, 2016
Sold by
Delsanto David and Delsanto Janet
Bought by
Delsanto Janet
Current Estimated Value
Purchase Details
Closed on
Jul 31, 1996
Sold by
Scorpio Elaine
Bought by
Piccolo Janet J
Purchase Details
Closed on
Aug 26, 1991
Sold by
Piccolo Louis V
Bought by
Scorpio Elaine
Create a Home Valuation Report for This Property
The Home Valuation Report is an in-depth analysis detailing your home's value as well as a comparison with similar homes in the area
Home Values in the Area
Average Home Value in this Area
Purchase History
| Date | Buyer | Sale Price | Title Company |
|---|---|---|---|
| Delsanto Janet | -- | -- | |
| Piccolo Janet J | $119,000 | -- | |
| Scorpio Elaine | $115,000 | -- |
Source: Public Records
Mortgage History
| Date | Status | Borrower | Loan Amount |
|---|---|---|---|
| Closed | Scorpio Elaine | $17,000 | |
| Previous Owner | Scorpio Elaine | $165,000 | |
| Previous Owner | Scorpio Elaine | $21,300 |
Source: Public Records
Tax History
| Year | Tax Paid | Tax Assessment Tax Assessment Total Assessment is a certain percentage of the fair market value that is determined by local assessors to be the total taxable value of land and additions on the property. | Land | Improvement |
|---|---|---|---|---|
| 2025 | $5,154 | $371,300 | $108,600 | $262,700 |
| 2024 | $5,053 | $371,300 | $108,600 | $262,700 |
| 2023 | $4,838 | $256,000 | $71,500 | $184,500 |
| 2022 | $4,739 | $256,000 | $71,500 | $184,500 |
| 2021 | $4,608 | $256,000 | $71,500 | $184,500 |
| 2020 | $4,848 | $233,400 | $68,100 | $165,300 |
| 2019 | $4,848 | $233,400 | $68,100 | $165,300 |
| 2018 | $4,736 | $233,400 | $68,100 | $165,300 |
| 2017 | $4,831 | $210,600 | $61,300 | $149,300 |
| 2016 | $4,728 | $210,600 | $61,300 | $149,300 |
| 2015 | $4,715 | $210,000 | $61,300 | $148,700 |
| 2014 | $4,319 | $189,100 | $61,300 | $127,800 |
Source: Public Records
Map
Nearby Homes
Your Personal Tour Guide
Ask me questions while you tour the home.