
Seller's Agent in 2014
Lynne Farrington
RE/MAX
(888) 345-7362
71 Total Sales
Estimated Value: $591,000 - $770,000
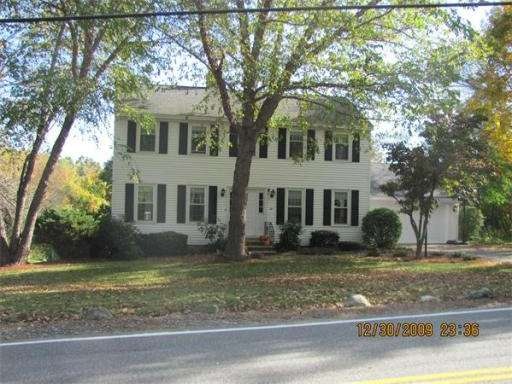
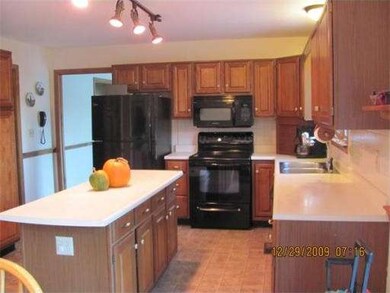
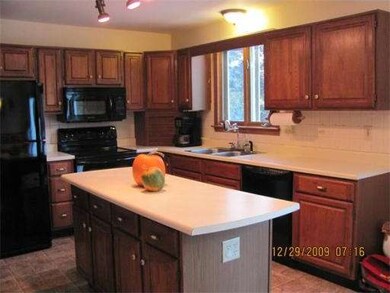
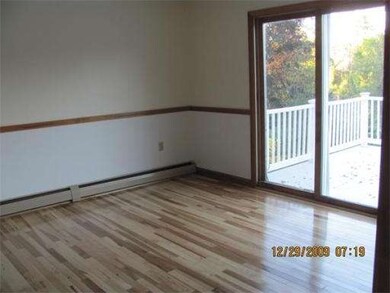
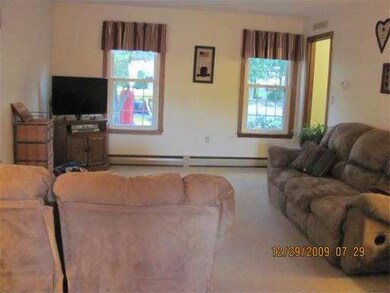
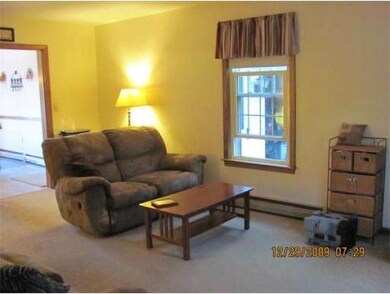
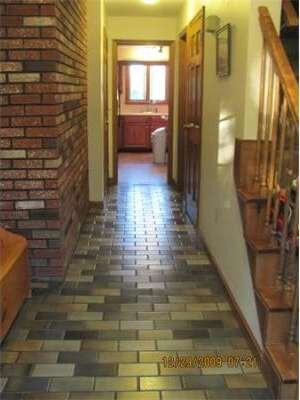
Great family home located in North Salem school district. This home features living room with gleaming hardwood floors with wood burning fireplace, dining room with new hickory flooring, kitchen with center island and appliances, and family room with wall to wall that completes the first floor. Great home to entertain in. The second floor master bedroom with bath., plus three additional bedrooms. This home is awaiting a new family to bring joy too! Come view it today. .
Home Type
Single Family
Est. Annual Taxes
$9,207
Year Built
1985
Lot Details
0
| Date | Buyer | Sale Price | Title Company |
|---|---|---|---|
| Morin Michael | $325,900 | -- | |
| Morin Michael | $325,900 | -- | |
| Nigohosian Kevin | $399,900 | -- | |
| Nigohosian Kevin | $399,900 | -- |
| Date | Status | Borrower | Loan Amount |
|---|---|---|---|
| Previous Owner | Nigohosian Kevin | $28,000 | |
| Previous Owner | Nigohosian Kevin | $260,700 | |
| Previous Owner | Nigohosian Kevin | $279,930 | |
| Closed | Nigohosian Kevin | $0 |
| Date | Event | Price | Change | Sq Ft Price |
|---|---|---|---|---|
| 07/30/2014 07/30/14 | Sold | $312,500 | 0.0% | $142 / Sq Ft |
| 06/26/2014 06/26/14 | Off Market | $312,500 | -- | -- |
| 06/06/2014 06/06/14 | Price Changed | $315,000 | -3.1% | $143 / Sq Ft |
| 05/14/2014 05/14/14 | Price Changed | $325,000 | -1.2% | $148 / Sq Ft |
| 04/05/2014 04/05/14 | Price Changed | $329,000 | -1.6% | $149 / Sq Ft |
| 03/12/2014 03/12/14 | Price Changed | $334,500 | -1.3% | $152 / Sq Ft |
| 02/07/2014 02/07/14 | For Sale | $339,000 | +8.5% | $154 / Sq Ft |
| 01/30/2014 01/30/14 | Off Market | $312,500 | -- | -- |
| 10/26/2013 10/26/13 | Price Changed | $339,000 | -2.9% | $154 / Sq Ft |
| 10/16/2013 10/16/13 | Price Changed | $349,000 | -5.4% | $158 / Sq Ft |
| 10/03/2013 10/03/13 | For Sale | $369,000 | -- | $167 / Sq Ft |
| Year | Tax Paid | Tax Assessment Tax Assessment Total Assessment is a certain percentage of the fair market value that is determined by local assessors to be the total taxable value of land and additions on the property. | Land | Improvement |
|---|---|---|---|---|
| 2024 | $9,207 | $523,100 | $191,700 | $331,400 |
| 2023 | $8,872 | $523,100 | $191,700 | $331,400 |
| 2022 | $8,396 | $523,100 | $191,700 | $331,400 |
| 2021 | $8,359 | $523,100 | $191,700 | $331,400 |
| 2020 | $8,125 | $369,000 | $136,900 | $232,100 |
| 2019 | $8,111 | $369,000 | $136,900 | $232,100 |
| 2018 | $7,974 | $369,000 | $136,900 | $232,100 |
| 2017 | $7,690 | $369,000 | $136,900 | $232,100 |
| 2016 | $7,539 | $369,000 | $136,900 | $232,100 |
| 2015 | $6,892 | $322,200 | $135,400 | $186,800 |
| 2014 | $6,699 | $322,200 | $135,400 | $186,800 |
| 2013 | $6,592 | $322,200 | $135,400 | $186,800 |
Seller's Agent in 2014
Lynne Farrington
RE/MAX
(888) 345-7362
71 Total Sales
Source: MLS Property Information Network (MLS PIN)
MLS Number: 71592332
APN: SLEM-000039-006552
Disclaimer: Certain information contained herein is derived from information provided by parties other than Homes.com. All information provided is deemed reliable, but is not guaranteed to be accurate and should be independently verified.
![]() The property listing data and information, or the Images, set forth herein were provided to MLS Property Information Network, Inc. from third party sources, including sellers, lessors and public records, and were compiled by MLS Property Information Network, Inc. The property listing data and information, and the Images, are for the personal, non-commercial use of consumers having a good faith interest in purchasing or leasing listed properties of the type displayed to them and may not be used for any purpose other than to identify prospective properties which such consumers may have a good faith interest in purchasing or leasing. MLS Property Information Network, Inc. and its subscribers disclaim any and all representations and warranties as to the accuracy of the property listing data and information, or as to the accuracy of any of the Images, set forth herein.
The property listing data and information, or the Images, set forth herein were provided to MLS Property Information Network, Inc. from third party sources, including sellers, lessors and public records, and were compiled by MLS Property Information Network, Inc. The property listing data and information, and the Images, are for the personal, non-commercial use of consumers having a good faith interest in purchasing or leasing listed properties of the type displayed to them and may not be used for any purpose other than to identify prospective properties which such consumers may have a good faith interest in purchasing or leasing. MLS Property Information Network, Inc. and its subscribers disclaim any and all representations and warranties as to the accuracy of the property listing data and information, or as to the accuracy of any of the Images, set forth herein.