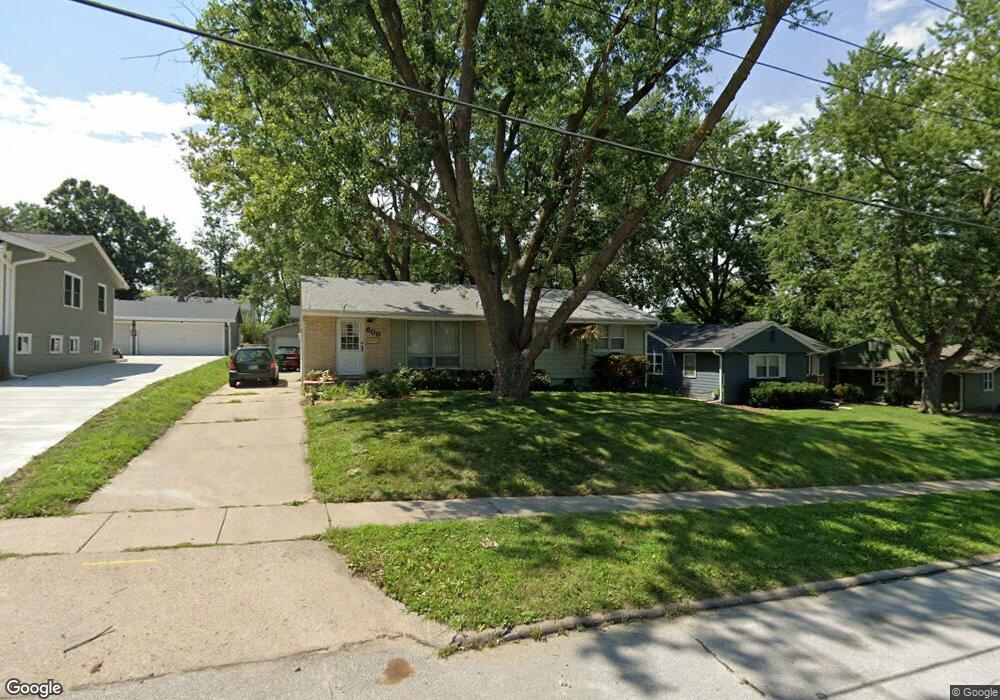
600 30th St West Des Moines, IA 50265
Estimated Value: $279,000 - $303,000
3
Beds
3
Baths
1,200
Sq Ft
$241/Sq Ft
Est. Value
About This Home
This home is located at 600 30th St, West Des Moines, IA 50265 and is currently estimated at $289,345, approximately $241 per square foot. 600 30th St is a home located in Polk County with nearby schools including Fairmeadows Elementary School, Stilwell Junior High School, and Valley Southwoods Freshman High School.
Ownership History
Date
Name
Owned For
Owner Type
Purchase Details
Closed on
Jun 15, 1999
Sold by
Renken Troy
Bought by
Grimes Karen A
Current Estimated Value
Home Financials for this Owner
Home Financials are based on the most recent Mortgage that was taken out on this home.
Original Mortgage
$95,120
Interest Rate
7.06%
Mortgage Type
Balloon
Purchase Details
Closed on
Jun 6, 1998
Sold by
Fear Craig S and Baker Fear Deborah A
Bought by
Renken Troy
Home Financials for this Owner
Home Financials are based on the most recent Mortgage that was taken out on this home.
Original Mortgage
$99,465
Interest Rate
7.22%
Create a Home Valuation Report for This Property
The Home Valuation Report is an in-depth analysis detailing your home's value as well as a comparison with similar homes in the area
Home Values in the Area
Average Home Value in this Area
Purchase History
| Date | Buyer | Sale Price | Title Company |
|---|---|---|---|
| Grimes Karen A | $118,500 | -- | |
| Renken Troy | $104,500 | -- |
Source: Public Records
Mortgage History
| Date | Status | Borrower | Loan Amount |
|---|---|---|---|
| Closed | Grimes Karen A | $95,120 | |
| Previous Owner | Renken Troy | $99,465 |
Source: Public Records
Tax History Compared to Growth
Tax History
| Year | Tax Paid | Tax Assessment Tax Assessment Total Assessment is a certain percentage of the fair market value that is determined by local assessors to be the total taxable value of land and additions on the property. | Land | Improvement |
|---|---|---|---|---|
| 2025 | $3,628 | $270,600 | $71,800 | $198,800 |
| 2024 | $3,628 | $239,400 | $62,500 | $176,900 |
| 2023 | $3,618 | $239,400 | $62,500 | $176,900 |
| 2022 | $3,572 | $196,200 | $53,000 | $143,200 |
| 2021 | $3,548 | $196,200 | $53,000 | $143,200 |
| 2020 | $3,490 | $185,500 | $50,000 | $135,500 |
| 2019 | $3,232 | $185,500 | $50,000 | $135,500 |
| 2018 | $3,236 | $166,300 | $43,800 | $122,500 |
| 2017 | $3,020 | $166,300 | $43,800 | $122,500 |
| 2016 | $2,950 | $151,400 | $39,400 | $112,000 |
| 2015 | $2,950 | $151,400 | $39,400 | $112,000 |
| 2014 | $2,868 | $150,300 | $38,300 | $112,000 |
Source: Public Records
Map
Nearby Homes