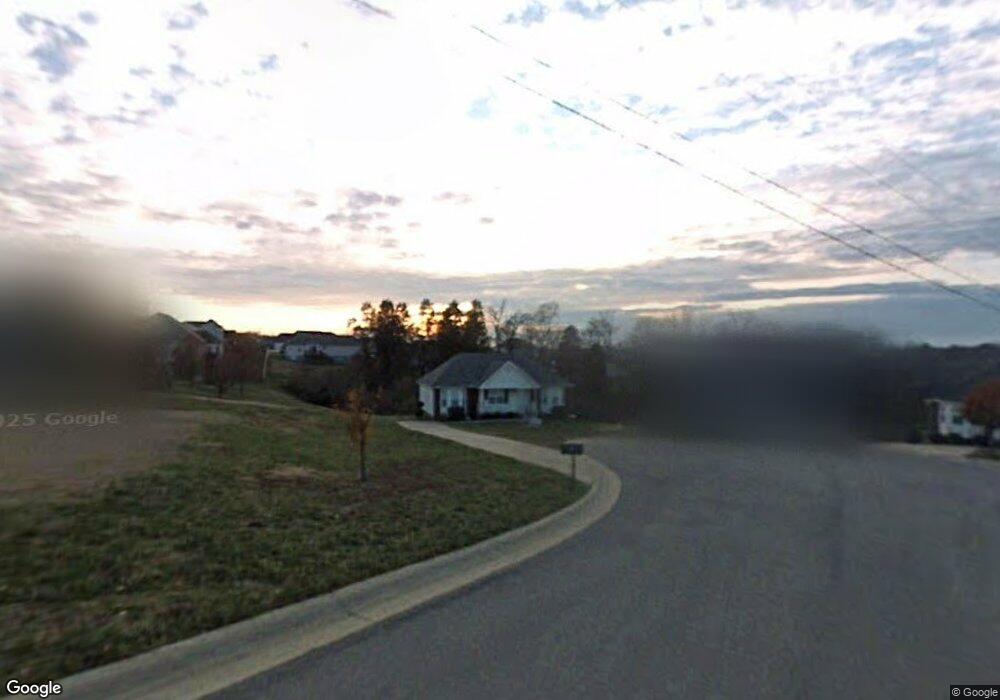
600 Cahaba Ct Mount Juliet, TN 37122
Estimated Value: $330,020 - $396,000
Studio
2
Baths
1,232
Sq Ft
$296/Sq Ft
Est. Value
About This Home
This home is located at 600 Cahaba Ct, Mount Juliet, TN 37122 and is currently estimated at $364,755, approximately $296 per square foot. 600 Cahaba Ct is a home located in Wilson County with nearby schools including W.A. Wright Elementary School, Mt. Juliet Middle School, and Green Hill High School.
Ownership History
Date
Name
Owned For
Owner Type
Purchase Details
Closed on
Jan 10, 2008
Sold by
Jenny Smith
Bought by
Farris Brian S
Current Estimated Value
Purchase Details
Closed on
May 2, 2006
Sold by
Jeremy Hawks
Bought by
Jenny Hawks
Home Financials for this Owner
Home Financials are based on the most recent Mortgage that was taken out on this home.
Original Mortgage
$110,000
Interest Rate
6.28%
Purchase Details
Closed on
Apr 21, 2006
Sold by
Jeremy Hawks
Bought by
Jenny Hawks
Home Financials for this Owner
Home Financials are based on the most recent Mortgage that was taken out on this home.
Original Mortgage
$110,000
Interest Rate
6.28%
Purchase Details
Closed on
Jun 7, 2002
Sold by
Universal Builders
Bought by
Jeremy Hawks
Home Financials for this Owner
Home Financials are based on the most recent Mortgage that was taken out on this home.
Original Mortgage
$109,137
Interest Rate
6.98%
Create a Home Valuation Report for This Property
The Home Valuation Report is an in-depth analysis detailing your home's value as well as a comparison with similar homes in the area
Home Values in the Area
Average Home Value in this Area
Purchase History
| Date | Buyer | Sale Price | Title Company |
|---|---|---|---|
| Farris Brian S | $130,000 | -- | |
| Jenny Hawks | -- | -- | |
| Jenny Hawks | -- | -- | |
| Jeremy Hawks | $110,000 | -- |
Source: Public Records
Mortgage History
| Date | Status | Borrower | Loan Amount |
|---|---|---|---|
| Previous Owner | Jeremy Hawks | $110,000 | |
| Previous Owner | Jeremy Hawks | $109,137 |
Source: Public Records
Tax History
| Year | Tax Paid | Tax Assessment Tax Assessment Total Assessment is a certain percentage of the fair market value that is determined by local assessors to be the total taxable value of land and additions on the property. | Land | Improvement |
|---|---|---|---|---|
| 2025 | $157 | $54,025 | $17,500 | $36,525 |
| 2024 | $1,031 | $54,025 | $17,500 | $36,525 |
| 2022 | $1,031 | $54,025 | $17,500 | $36,525 |
| 2021 | $1,091 | $54,025 | $17,500 | $36,525 |
| 2020 | $1,023 | $54,025 | $17,500 | $36,525 |
| 2019 | $126 | $38,050 | $13,750 | $24,300 |
| 2018 | $1,021 | $38,050 | $13,750 | $24,300 |
| 2017 | $1,021 | $38,050 | $13,750 | $24,300 |
| 2016 | $1,021 | $38,050 | $13,750 | $24,300 |
| 2015 | $1,054 | $38,050 | $13,750 | $24,300 |
| 2014 | $852 | $30,742 | $0 | $0 |
Source: Public Records
Map
Nearby Homes
- 803 Pebble Point
- 686 Whispering Breeze
- 811 Pebble Beach Cir
- 705 Pinehurst Point
- 3435 Weston Way
- 3008 Cedar Creek Dr
- 3194 Buchanan
- 420 Mabels Way
- 453 Mabels Way
- 734 Nonaville Rd
- 870 Nonaville Rd
- 2550 Ashford Dr
- 72 Sports Rd
- 5610 Toulouse St
- 522 N Greenhill Rd
- 5341 Bayou Dr
- 0 Nonaville Rd Unit RTC2760488
- 805 Saddle Ridge Dr
- 217 Pin High Dr
- 808 Saddle Ridge Dr
- 1050 Windtree Trace
- 602 Cahaba Ct
- 1048 Windtree Trace
- 1052 Windtree Trace
- 604 Cahaba Ct
- 603 Cahaba Ct
- 605 Cahaba Ct
- 601 Cahaba Ct
- 1054 Windtree Trace
- 1046 Windtree Trace
- 900 Pebble Beach Cir
- 806 Pebble Point
- 904 Pebble Beach Cir
- 1039 Windtree Trace
- 908 Pebble Beach Cir
- 804 Pebble Point
- 1037 Windtree Trace
- 706 Veneta View Dr
- 708 Veneta View Dr
- 710 Veneta View Dr
Your Personal Tour Guide
Ask me questions while you tour the home.