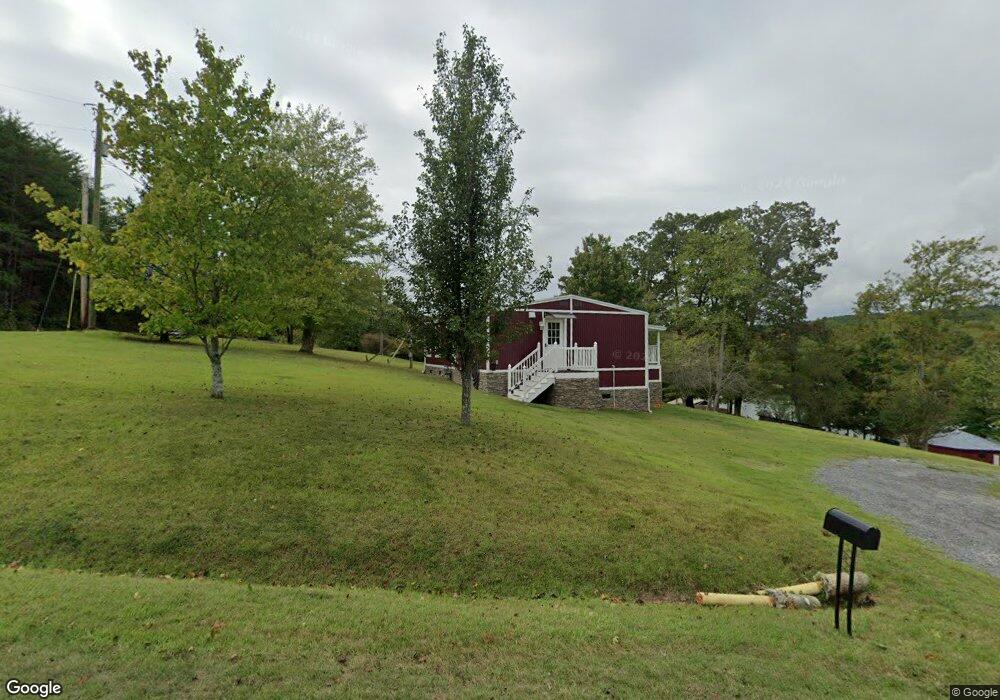
600 Debbie Dr Spring City, TN 37381
Estimated Value: $366,014 - $446,000
Studio
--
Bath
160
Sq Ft
$2,513/Sq Ft
Est. Value
About This Home
This home is located at 600 Debbie Dr, Spring City, TN 37381 and is currently estimated at $402,004, approximately $2,512 per square foot. 600 Debbie Dr is a home with nearby schools including Rhea County High School.
Ownership History
Date
Name
Owned For
Owner Type
Purchase Details
Closed on
Sep 25, 2020
Sold by
Sparkman James T
Bought by
West David M and West Patricia A
Current Estimated Value
Purchase Details
Closed on
Mar 24, 2017
Sold by
Sparkman Sephanie R
Bought by
Sparkman James T
Purchase Details
Closed on
Sep 13, 1999
Sold by
Fredregill Ernest J
Bought by
Sparkman James T
Home Financials for this Owner
Home Financials are based on the most recent Mortgage that was taken out on this home.
Original Mortgage
$25,000
Interest Rate
7.91%
Purchase Details
Closed on
Mar 24, 1992
Bought by
Fredregill Ernest J and Fredregill Peggy J
Purchase Details
Closed on
May 8, 1990
Bought by
Wooters Monte A
Purchase Details
Closed on
Jan 12, 1990
Bought by
Kincannon Norman N and Kincannon Lupe R
Purchase Details
Closed on
Aug 25, 1989
Bought by
Hill Danny L
Purchase Details
Closed on
Apr 2, 1982
Bought by
Lejeune Ronald Edwin
Purchase Details
Closed on
Feb 2, 1982
Purchase Details
Closed on
Feb 19, 1981
Purchase Details
Closed on
Jan 9, 1978
Create a Home Valuation Report for This Property
The Home Valuation Report is an in-depth analysis detailing your home's value as well as a comparison with similar homes in the area
Home Values in the Area
Average Home Value in this Area
Purchase History
| Date | Buyer | Sale Price | Title Company |
|---|---|---|---|
| West David M | $180,000 | Equimax Title Llc | |
| Sparkman James T | -- | -- | |
| Sparkman James T | $25,000 | -- | |
| Fredregill Ernest J | $16,500 | -- | |
| Wooters Monte A | $14,500 | -- | |
| Kincannon Norman N | $11,500 | -- | |
| Hill Danny L | -- | -- | |
| Lejeune Ronald Edwin | -- | -- | |
| -- | -- | -- | |
| -- | -- | -- | |
| -- | -- | -- |
Source: Public Records
Mortgage History
| Date | Status | Borrower | Loan Amount |
|---|---|---|---|
| Previous Owner | Not Available | $25,000 |
Source: Public Records
Tax History
| Year | Tax Paid | Tax Assessment Tax Assessment Total Assessment is a certain percentage of the fair market value that is determined by local assessors to be the total taxable value of land and additions on the property. | Land | Improvement |
|---|---|---|---|---|
| 2025 | $1,012 | $75,050 | $28,750 | $46,300 |
| 2024 | $1,012 | $75,050 | $28,750 | $46,300 |
| 2023 | $948 | $42,050 | $20,000 | $22,050 |
| 2022 | $647 | $28,700 | $20,000 | $8,700 |
| 2021 | $525 | $23,275 | $20,000 | $3,275 |
| 2020 | $525 | $23,275 | $20,000 | $3,275 |
| 2019 | $525 | $23,275 | $20,000 | $3,275 |
| 2018 | $524 | $23,850 | $20,000 | $3,850 |
| 2017 | $524 | $23,850 | $20,000 | $3,850 |
| 2016 | $551 | $23,850 | $20,000 | $3,850 |
| 2015 | $526 | $25,100 | $20,000 | $5,100 |
| 2014 | $526 | $25,100 | $20,000 | $5,100 |
| 2013 | -- | $25,100 | $20,000 | $5,100 |
Source: Public Records
Map
Nearby Homes
- 254 Karen Dr
- 700 Ewing Cemetery Rd
- 1112 Groover Rd
- 1724 Euchee Chapel Rd
- 0 Scenic Lakeview Dr Unit RTC3123004
- 2285 Euchee Chapel Rd
- 341 Clearwater Dr
- 763 Waterfront Way
- 476 Waterfront Way
- 0 Red Cloud Ln Unit 1325492
- 264 Waterfront Way
- 64 Edgewater Way
- 865 Ewing Rd
- 0 Edgewater Way
- 212 Overlook Dr
- 347 Water View Dr
- 200 Waterside Way
- Lot 39 Waterside Way
- 122 Waterside Way
- 481 Hidden Forest Trail
- 540 Debbie Dr
- Lot 24 Debbie Dr Unit 24
- Lot 24 Debbie Dr
- 720 Debbie Dr
- lot #24 Debbie Dr
- 720 Debbie Dr Unit Lot 75
- lot #24 Debbie Dr Unit lot 24
- 0 Lot #24 Debbie Dr Unit 1070727
- 529 Debbie Dr
- 583 Debbie Dr
- 140 Karen Dr
- 601 Debbie Dr
- 511 Debbie Dr
- 623 Debbie Dr
- 498 Debbie Dr
- 178 Karen Dr
- 646 Debbie Dr
- 635 Debbie Dr
- 487 Debbie Dr
- 175 Karen Dr
Your Personal Tour Guide
Ask me questions while you tour the home.