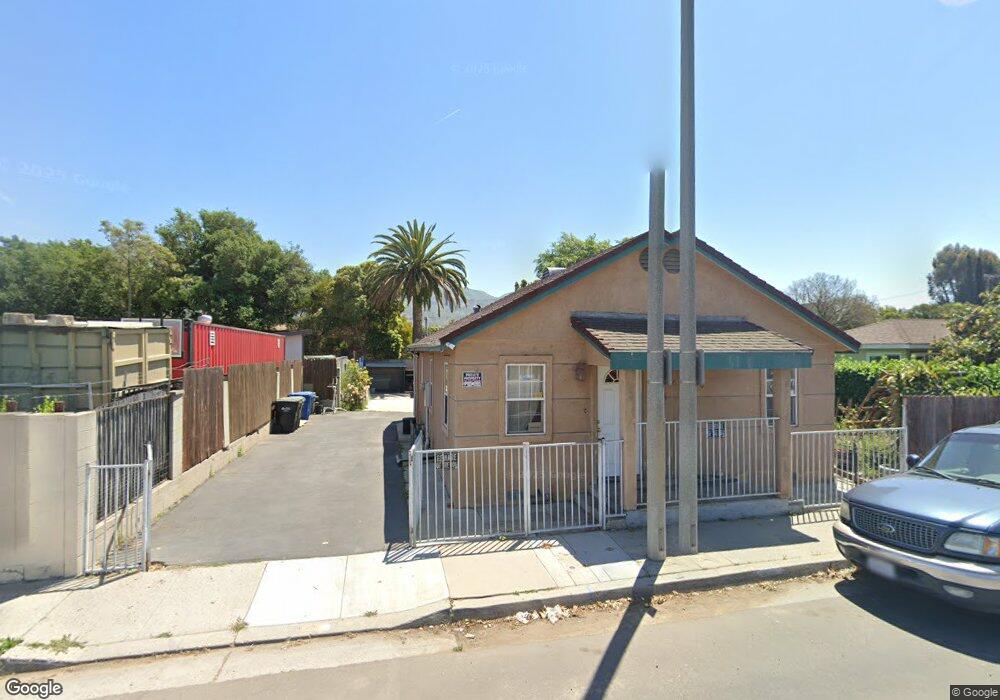
600 E Harvard Blvd Santa Paula, CA 93060
Estimated Value: $479,000 - $640,000
3
Beds
1
Bath
923
Sq Ft
$612/Sq Ft
Est. Value
About This Home
This home is located at 600 E Harvard Blvd, Santa Paula, CA 93060 and is currently estimated at $564,884, approximately $612 per square foot. 600 E Harvard Blvd is a home located in Ventura County with nearby schools including Grace S. Thille Elementary School, Isbell Middle, and Santa Paula High.
Ownership History
Date
Name
Owned For
Owner Type
Purchase Details
Closed on
May 23, 2002
Sold by
Hud
Bought by
Ponce Herachio and Ponce Maria Teresa
Current Estimated Value
Home Financials for this Owner
Home Financials are based on the most recent Mortgage that was taken out on this home.
Original Mortgage
$117,431
Interest Rate
6.71%
Purchase Details
Closed on
Dec 12, 2001
Sold by
North American Mtg Corp
Bought by
Hud
Purchase Details
Closed on
Sep 19, 2001
Sold by
Arriaga Jose M and Arriaga Agustin
Bought by
North American Mtg Company
Purchase Details
Closed on
May 24, 2000
Sold by
Arriaga Ronda
Bought by
Arriaga Jose M
Purchase Details
Closed on
Mar 17, 2000
Sold by
Ann Sorric Mary
Bought by
Arriaga Jose M and Arriaga Agustin
Home Financials for this Owner
Home Financials are based on the most recent Mortgage that was taken out on this home.
Original Mortgage
$128,306
Interest Rate
8.67%
Mortgage Type
FHA
Create a Home Valuation Report for This Property
The Home Valuation Report is an in-depth analysis detailing your home's value as well as a comparison with similar homes in the area
Home Values in the Area
Average Home Value in this Area
Purchase History
| Date | Buyer | Sale Price | Title Company |
|---|---|---|---|
| Ponce Herachio | $147,000 | First Southwestern Title Co | |
| Hud | -- | First American Title Co | |
| North American Mtg Company | $141,403 | Benefit Land Title Ins Co | |
| Arriaga Jose M | -- | First American Title Ins Co | |
| Arriaga Jose M | $130,000 | First American Title Ins Co |
Source: Public Records
Mortgage History
| Date | Status | Borrower | Loan Amount |
|---|---|---|---|
| Previous Owner | Ponce Herachio | $117,431 | |
| Previous Owner | Arriaga Jose M | $128,306 | |
| Closed | Arriaga Jose M | $6,500 |
Source: Public Records
Tax History
| Year | Tax Paid | Tax Assessment Tax Assessment Total Assessment is a certain percentage of the fair market value that is determined by local assessors to be the total taxable value of land and additions on the property. | Land | Improvement |
|---|---|---|---|---|
| 2025 | $2,393 | $212,581 | $144,820 | $67,761 |
| 2024 | $2,393 | $208,413 | $141,980 | $66,433 |
| 2023 | $2,343 | $204,327 | $139,196 | $65,131 |
| 2022 | $2,273 | $200,321 | $136,467 | $63,854 |
| 2021 | $2,266 | $196,394 | $133,792 | $62,602 |
| 2020 | $2,254 | $194,382 | $132,421 | $61,961 |
| 2019 | $2,131 | $190,572 | $129,825 | $60,747 |
| 2018 | $2,104 | $186,836 | $127,280 | $59,556 |
| 2017 | $2,126 | $183,174 | $124,785 | $58,389 |
| 2016 | $1,999 | $179,584 | $122,339 | $57,245 |
| 2015 | $1,910 | $176,888 | $120,502 | $56,386 |
| 2014 | $1,939 | $173,426 | $118,143 | $55,283 |
Source: Public Records
Map
Nearby Homes
- 114 E Ventura St Unit H
- 129 E Ventura St Unit A
- 102 E Ventura St Unit A
- 120 S Ojai St
- 573 Eureka Dr
- 2025 Oreste Ln
- 2046 Oreste Ln
- 2037 Oreste Ln
- 2040 Pyrenes Place
- 2041 Oreste Ln
- 2018 Pyrenes Place
- 2019 Pyrenes Place
- 2028 Pyrenes Place
- 587 Eureka Dr
- 561 Eureka Dr
- 2040 Oreste Ln
- 2032 Pyrenes Place
- 690 Ledgestone Dr
- 689 Ledgestone Dr
- 704 Ledgestone Dr
- 516 E Harvard Blvd
- 512 E Harvard Blvd
- 585 E Harvard Blvd
- 510 E Harvard Blvd
- 615 E Harvard Blvd
- 517 E Harvard Blvd
- 520 E Harvard Blvd
- 508 E Harvard Blvd
- 311 S 5th St
- 701 E Harvard Blvd
- 705 E Harvard Blvd
- 704 Harvard Blvd
- 305 S 5th St
- 244 S 7th St
- 242 S 7th St
- 236 S 7th St
- 709 E Harvard Blvd
- 314 S 5th St
- 234 S 7th St
- 245 S 7th St
Your Personal Tour Guide
Ask me questions while you tour the home.