NOT LISTED FOR SALE

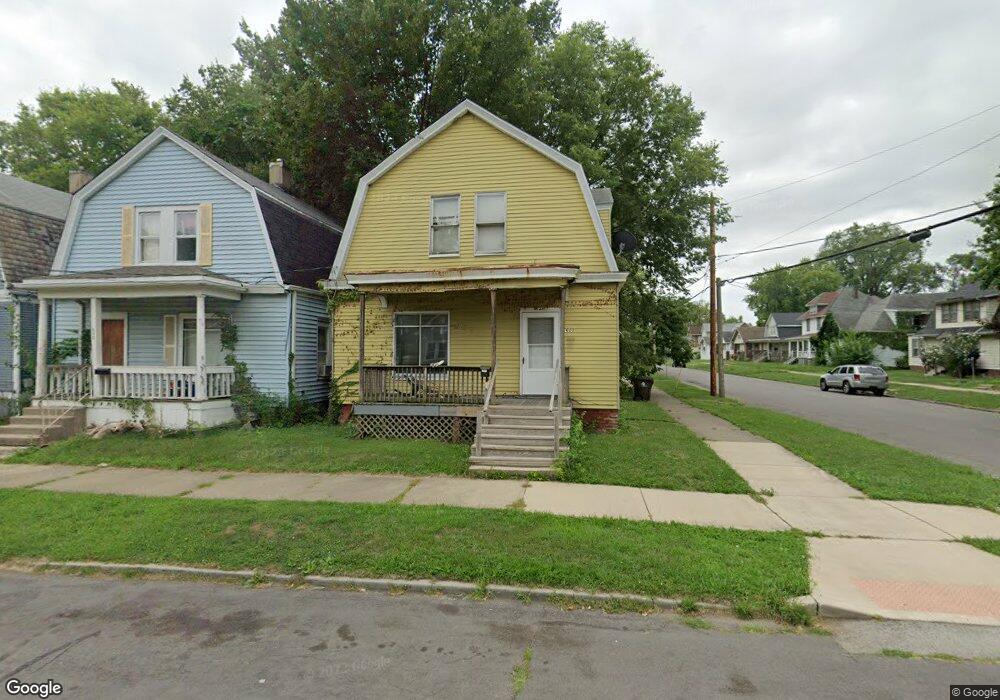
Estimated Value: $32,000 - $57,000

3 Beds
1 Bath
1,176 Sq Ft
$38/Sq Ft Est. Value

Last Sold March 01, 2023

Last sale price $18,286 $16 Per Sq Ft

Est. 144% increase in value since last sale

Current estimated payment $298/month

About This Home

Great investment opportunity! Package of 7 homes available in Peoria.

Ownership History

Date Name Owned For Owner Type

Purchase Details

Listed on
Jan 25, 2023
Closed on
Mar 13, 2023
Sold by
Nsb Investments Llc
Bought by
Nsb Investments Llc Series 1400
Seller's Agent
Troy Kerrn
Keller Williams Premier Realty
Buyer's Agent
Tracy Morris
eXp Realty
List Price
$21,000
Sold Price
$18,286
Premium/Discount to List
-$2,714
-12.92%
Current Estimated Value
$44,667

Home Financials for this Owner

Home Financials are based on the most recent Mortgage that was taken out on this home.
Estimated Appreciation
$26,381
Avg. Annual Appreciation
39.90%

Purchase Details

Listed on
Jan 25, 2023
Closed on
Mar 8, 2023
Sold by
Steves Midwest Rentals Inc
Bought by
Nsb Investments Llc
Seller's Agent
Troy Kerrn
Keller Williams Premier Realty
Buyer's Agent
Tracy Morris
eXp Realty
List Price
$21,000
Sold Price
$18,286
Premium/Discount to List
-$2,714
-12.92%

Purchase Details

Listed on
Feb 7, 2019
Closed on
Apr 23, 2019
Sold by
Rbt Advisors Llc
Bought by
Steves Midwest Rentals Inc
Seller's Agent
Christine Schauble
eXp Realty
Buyer's Agent
Mary Davis
Gallery Homes Real Estate
List Price
$15,000
Sold Price
$14,000
Premium/Discount to List
-$1,000
-6.67%

Home Financials for this Owner

Home Financials are based on the most recent Mortgage that was taken out on this home.
Avg. Annual Appreciation
7.22%

Purchase Details

Closed on
Jun 27, 2007
Bought by
L H Peoria Real Estate Llc
Source: Public Records

Range of Values:

Collateral Analytics

Collateral Analytics Collateral Analytics AVMs (Automated Valuation Model) employ a number of statistical approaches combined with neighborhood-specific comparable selection guarantees the most up-to-date and precise valuations.

Not Available

Collateral Analytics does not have data for the current month. Please view the chart for historical values.

ICE

ICE Mortgage Technology ICE Mortgage Technology’s AVM (Automated Valuation Model) is a state-of-the-art online residential property valuation tool that provides a quick and accurate estimate of the value of almost any home in the U.S.

Not Available

ICE Mortgage Technology does not have data for the current month. Please view the chart for historical values.

First American

First American First American Data & Analytics’ next-generation AVM combines unrivaled data assets with a blended ensemble of valuation models to produce highly accurate, reliable valuations you can trust.

Not Available

First American does not have data for the current month. Please view the chart for historical values.

Quantarium

Quantarium Quantarium’s valuation service, repeatedly proven the industry’s most accurate and comprehensive, is supercharged with a self-learning and auto-tuning AI engine that continually becomes smarter and more accurate as it processes daily inputs from the industry’s leading RE data lake.

Not Available

Quantarium does not have data for the current month. Please view the chart for historical values.

Average Value
Not Available
List Price
Sold Price
Create a Home Valuation Report for This Property
The Home Valuation Report is an in-depth analysis detailing your home's value as well as a comparison with similar homes in the area

Home Values in the Area

Source: Public Records

Average Home Value in this Area


Source: Public Records

Purchase History

Date Buyer Sale Price Title Company
Nsb Investments Llc Series 1400 -- --
Nsb Investments Llc $18,286 --
Steves Midwest Rentals Inc $99,000 Attorney Only
L H Peoria Real Estate Llc $26,500 --
Source: Public Records

Property History

Date Event Price List to Sale Price per Sq Ft Prior Sale
03/01/2023 03/01/23 Sold $18,286 -12.9% $16 / Sq Ft View Prior Sale
02/07/2023 02/07/23 Pending -- -- --
01/25/2023 01/25/23 For Sale $21,000 +50.0% $18 / Sq Ft
05/03/2019 05/03/19 Sold $14,000 -6.7% $12 / Sq Ft View Prior Sale
02/12/2019 02/12/19 Pending -- -- --
02/07/2019 02/07/19 For Sale $15,000 -25.0% $13 / Sq Ft
05/29/2015 05/29/15 Sold $20,000 -19.7% $17 / Sq Ft View Prior Sale
05/01/2015 05/01/15 Pending -- -- --
04/22/2015 04/22/15 For Sale $24,900 -- $21 / Sq Ft

Tax History Compared to Growth

Source: Public Records

Tax History

Year Tax Paid Tax Assessment Tax Assessment Total Assessment is a certain percentage of the fair market value that is determined by local assessors to be the total taxable value of land and additions on the property. Land Improvement
2024 $756 $8,360 $1,380 $6,980
2023 $722 $7,670 $1,270 $6,400
2022 $608 $6,300 $1,190 $5,110
2021 $597 $6,000 $1,130 $4,870
2020 $595 $5,940 $1,120 $4,820
2019 $604 $6,060 $1,140 $4,920
2018 $656 $6,740 $1,220 $5,520
2017 $669 $6,810 $1,230 $5,580
2016 $651 $6,810 $1,230 $5,580
2015 $724 $6,680 $1,210 $5,470
2014 -- $7,710 $1,270 $6,440
2013 -- $7,810 $1,290 $6,520
Source: Public Records

Agents Affiliated with this Home

  • Section Image
  • Section Image
  • Section Image
  • Section Image
  • Section Image
See All Agents

Map