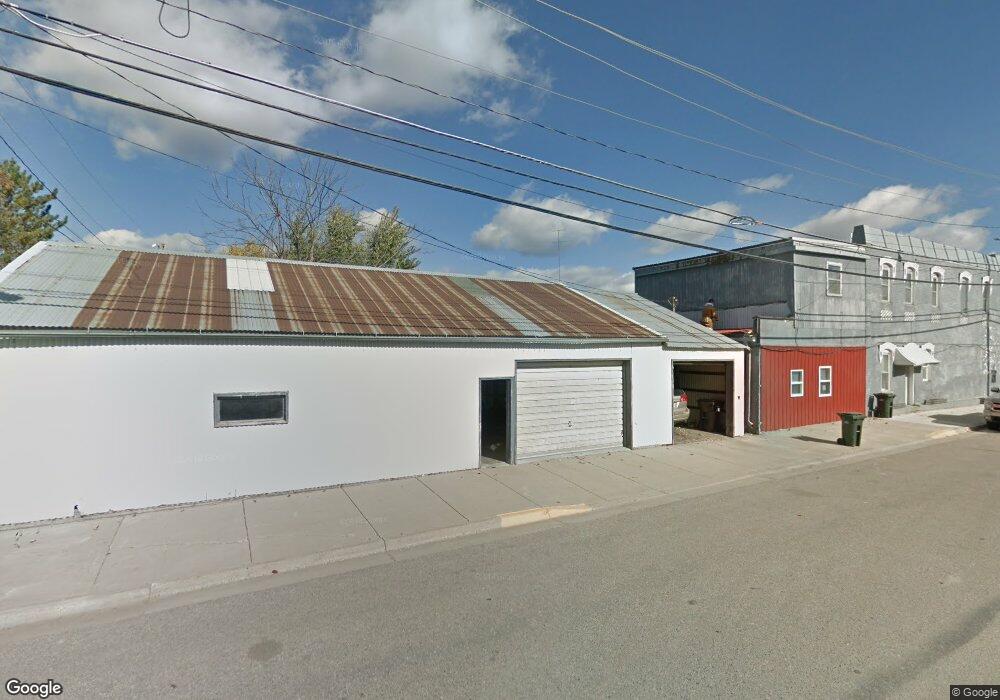
600 Main St N Browerville, MN 56438
Estimated Value: $126,000 - $166,000
--
Bed
3
Baths
279
Sq Ft
$544/Sq Ft
Est. Value
About This Home
This home is located at 600 Main St N, Browerville, MN 56438 and is currently estimated at $151,777, approximately $544 per square foot. 600 Main St N is a home located in Todd County with nearby schools including John Tartan Elementary School, William & Mary Scherkenbach Elementary School, and Browerville Secondary School.
Ownership History
Date
Name
Owned For
Owner Type
Purchase Details
Closed on
Aug 23, 2018
Sold by
Rdsl Rental Llc
Bought by
Montanez Juan A Chavez and Dechavez Ma Arisbeth
Current Estimated Value
Home Financials for this Owner
Home Financials are based on the most recent Mortgage that was taken out on this home.
Original Mortgage
$60,000
Outstanding Balance
$52,108
Interest Rate
4.5%
Mortgage Type
New Conventional
Estimated Equity
$99,669
Purchase Details
Closed on
Aug 20, 2018
Sold by
Rdsl Inc
Bought by
Miller Rdsl Rental Llc
Home Financials for this Owner
Home Financials are based on the most recent Mortgage that was taken out on this home.
Original Mortgage
$60,000
Outstanding Balance
$52,108
Interest Rate
4.5%
Mortgage Type
New Conventional
Estimated Equity
$99,669
Purchase Details
Closed on
May 15, 2009
Sold by
Santer George F and Santer Mary Jo
Bought by
R D S L Inc
Home Financials for this Owner
Home Financials are based on the most recent Mortgage that was taken out on this home.
Original Mortgage
$71,825
Interest Rate
4.84%
Mortgage Type
Future Advance Clause Open End Mortgage
Create a Home Valuation Report for This Property
The Home Valuation Report is an in-depth analysis detailing your home's value as well as a comparison with similar homes in the area
Home Values in the Area
Average Home Value in this Area
Purchase History
| Date | Buyer | Sale Price | Title Company |
|---|---|---|---|
| Montanez Juan A Chavez | $82,000 | None Available | |
| Miller Rdsl Rental Llc | $85,000 | None Available | |
| R D S L Inc | $85,000 | Home Town Title |
Source: Public Records
Mortgage History
| Date | Status | Borrower | Loan Amount |
|---|---|---|---|
| Open | Montanez Juan A Chavez | $60,000 | |
| Previous Owner | R D S L Inc | $71,825 |
Source: Public Records
Tax History Compared to Growth
Tax History
| Year | Tax Paid | Tax Assessment Tax Assessment Total Assessment is a certain percentage of the fair market value that is determined by local assessors to be the total taxable value of land and additions on the property. | Land | Improvement |
|---|---|---|---|---|
| 2025 | $2,084 | $152,900 | $2,400 | $150,500 |
| 2024 | $1,976 | $157,100 | $2,400 | $154,700 |
| 2023 | $1,668 | $148,300 | $2,400 | $145,900 |
| 2022 | $1,716 | $119,800 | $2,400 | $117,400 |
| 2021 | $1,784 | $103,800 | $2,400 | $101,400 |
| 2020 | $1,498 | $108,300 | $2,400 | $105,900 |
| 2019 | $1,538 | $82,900 | $2,400 | $80,500 |
| 2018 | $1,216 | $80,300 | $2,400 | $77,900 |
| 2017 | $1,284 | $58,300 | $2,400 | $55,900 |
| 2016 | $1,454 | $62,600 | $2,900 | $59,700 |
| 2015 | $1,324 | $0 | $0 | $0 |
| 2014 | -- | $0 | $0 | $0 |
Source: Public Records
Map
Nearby Homes
- 541 Creamery Ln S
- 841 Main St N
- 33896 County 21
- TBD County 61
- 0000 County 61
- 24355 350th St
- TBD 350th St
- 309 Leslie Ave E
- 27075 221st Ave
- 19167 344th St
- 19156 344th St
- TBD County 29
- 23245 380th St
- 24974 Hope Dr
- XXX County 29
- 18398 360th St
- 915 4th Ave NE
- 210 2nd Ave N
- 111 3rd St N
- 31393 Little Pine Ln