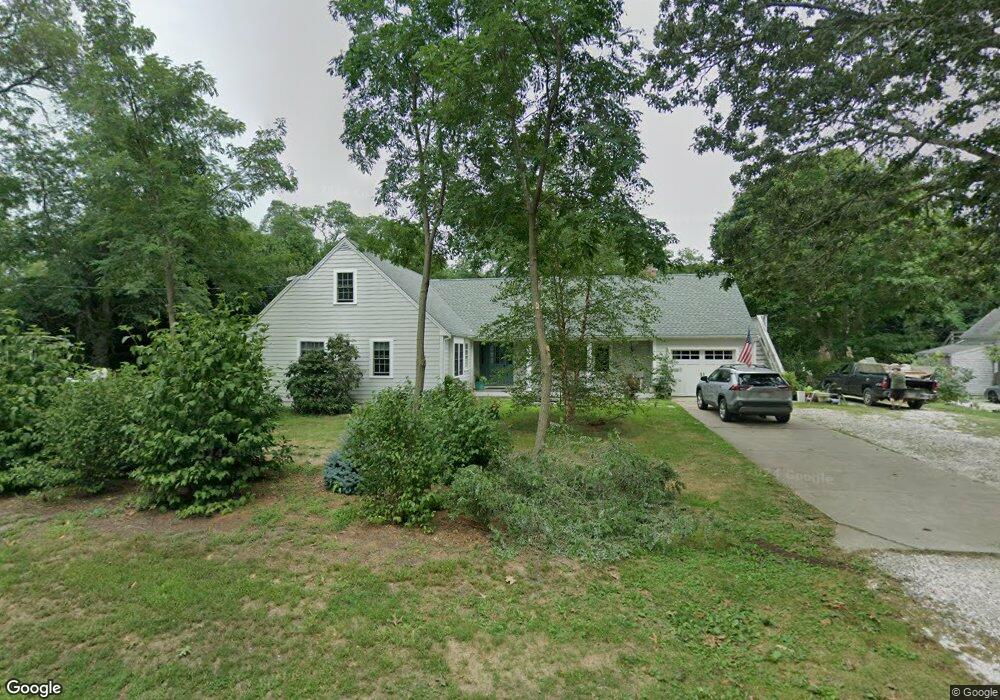
600 Massasoit Rd Eastham, MA 02642
Estimated Value: $868,000 - $1,026,000
4
Beds
3
Baths
2,265
Sq Ft
$424/Sq Ft
Est. Value
About This Home
This home is located at 600 Massasoit Rd, Eastham, MA 02642 and is currently estimated at $960,011, approximately $423 per square foot. 600 Massasoit Rd is a home located in Barnstable County with nearby schools including Eastham Elementary School, Nauset Regional Middle School, and Nauset Regional High School.
Ownership History
Date
Name
Owned For
Owner Type
Purchase Details
Closed on
Jul 1, 2016
Sold by
Brooks Marcella M
Bought by
Cestaro Edward G and Cestaro Melissa L
Current Estimated Value
Home Financials for this Owner
Home Financials are based on the most recent Mortgage that was taken out on this home.
Original Mortgage
$300,000
Outstanding Balance
$242,679
Interest Rate
4%
Mortgage Type
New Conventional
Estimated Equity
$717,332
Create a Home Valuation Report for This Property
The Home Valuation Report is an in-depth analysis detailing your home's value as well as a comparison with similar homes in the area
Home Values in the Area
Average Home Value in this Area
Purchase History
| Date | Buyer | Sale Price | Title Company |
|---|---|---|---|
| Cestaro Edward G | $400,000 | -- |
Source: Public Records
Mortgage History
| Date | Status | Borrower | Loan Amount |
|---|---|---|---|
| Open | Cestaro Edward G | $300,000 |
Source: Public Records
Tax History
| Year | Tax Paid | Tax Assessment Tax Assessment Total Assessment is a certain percentage of the fair market value that is determined by local assessors to be the total taxable value of land and additions on the property. | Land | Improvement |
|---|---|---|---|---|
| 2025 | $6,466 | $838,700 | $289,000 | $549,700 |
| 2024 | $5,247 | $748,500 | $252,500 | $496,000 |
| 2023 | $4,836 | $668,000 | $233,800 | $434,200 |
| 2022 | $4,499 | $524,400 | $208,700 | $315,700 |
| 2021 | $4,387 | $477,900 | $189,700 | $288,200 |
| 2020 | $4,047 | $464,100 | $193,600 | $270,500 |
| 2019 | $3,752 | $454,800 | $188,000 | $266,800 |
| 2018 | $3,719 | $445,400 | $182,500 | $262,900 |
| 2017 | $3,397 | $430,000 | $179,000 | $251,000 |
| 2016 | $3,338 | $448,600 | $198,800 | $249,800 |
| 2015 | $3,132 | $441,100 | $194,900 | $246,200 |
Source: Public Records
Map
Nearby Homes
- 35 Wiley Ln
- 20 Oak Rd
- 10 Bradford Ln
- 255 Massasoit Rd
- 18 Jay Dee Ln
- 495 Aspinet Rd
- 85 Huckleberry Ln
- 115 Wamsutta Rd
- 80 Quason Dr
- 255 Epanow Rd
- 5470 State Hwy
- 82 Old Orchard Rd
- 100 Gigi Ln
- 600 Kingsbury Beach Rd
- 340 Salt Works Rd
- 300 School House Rd
- 3098 State Hwy
- 65 Harmes Way
- 70 Deerfield Ln
- 49 Village Ln
Your Personal Tour Guide
Ask me questions while you tour the home.