Estimated payment $3,382/month
Highlights
- Spa
- No Units Above
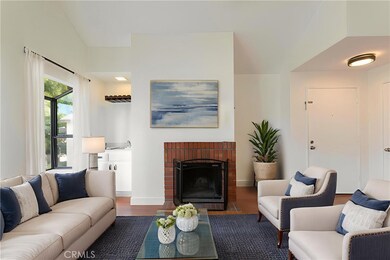
- Cathedral Ceiling
- William E. Fanning Elementary School Rated A
- Fireplace in Primary Bedroom
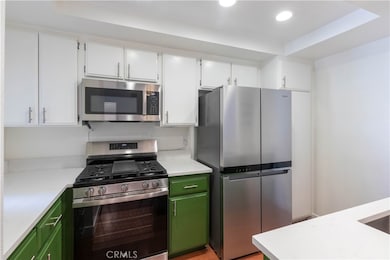
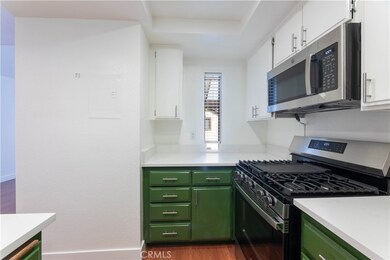
- Quartz Countertops
About This Home
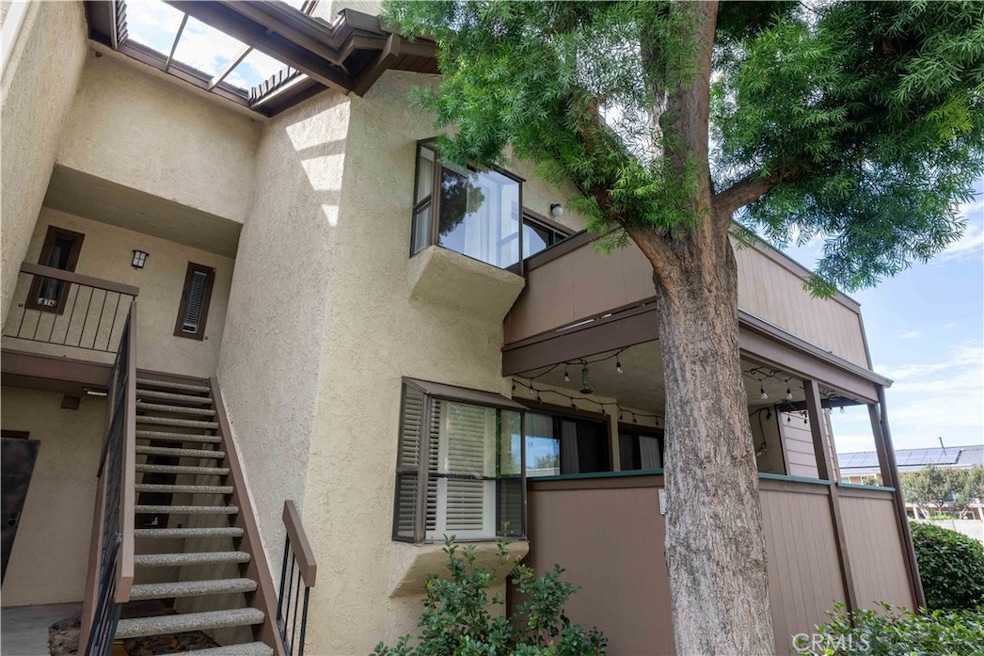
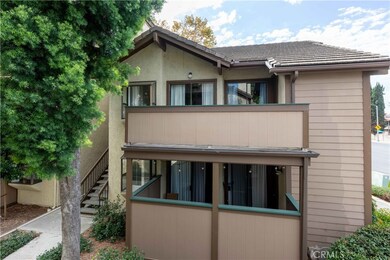
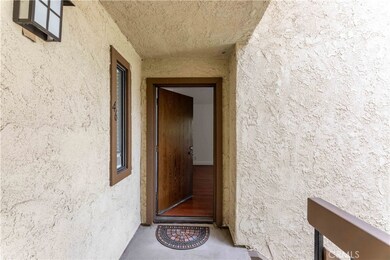
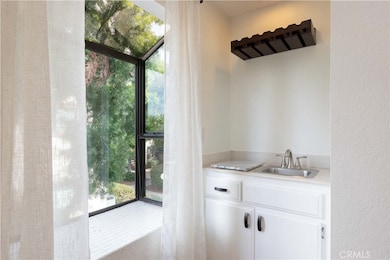
Welcome to this beautifully updated upper-level home in the sought-after Brea Canyon Villas community. This light-filled one-bedroom, one-bath residence features vaulted ceilings, a cozy fireplace, and a private balcony that’s accessible from both the living room and bedroom — perfect for relaxing or entertaining. The modern kitchen boasts sleek quartz countertops, stainless steel appliances, and plenty of cabinet space. A versatile nook has been thoughtfully transformed into a home office, ideal for remote work or creative pursuits. Additional highlights include laminate wood flooring, in-unit washer and dryer, and a spacious walk-in closet with custom shelving. Enjoy the convenience of a two-car garage and resort-style amenities such as a sparkling pool, spa, and car wash area. Located just minutes from Downtown Brea, Birch Street Promenade, Brea Mall, and an array of dining, shopping, and entertainment options. Outdoor enthusiasts will love the nearby parks, walking, and biking trails, plus easy access to the 57 freeway for commuting.
Experience modern comfort and low-maintenance living in one of Brea’s most desirable communities!
Listing Agent
Keller Williams Pacific Estate Brokerage Phone: 562-506-3352 License #01898581 Listed on: 10/22/2025

Property Details
Home Type
- Condominium
Est. Annual Taxes
- $4,057
Year Built
- Built in 1979
Lot Details
- No Units Above
- 1 Common Wall
HOA Fees
- $475 Monthly HOA Fees
Parking
- 2 Car Garage
Home Design
- Entry on the 2nd floor
- Tile Roof
Interior Spaces
- 851 Sq Ft Home
- 1-Story Property
- Cathedral Ceiling
- Ceiling Fan
- Living Room with Fireplace
- Neighborhood Views
- Laundry Room
Kitchen
- Eat-In Kitchen
- Gas Oven
- Gas Range
- Microwave
- Quartz Countertops
- Fireplace in Kitchen
Bedrooms and Bathrooms
- 1 Main Level Bedroom
- Fireplace in Primary Bedroom
- 1 Full Bathroom
- Quartz Bathroom Countertops
- Bathtub with Shower
Outdoor Features
- Spa
- Balcony
Schools
- Fallbrook Elementary School
- Brea Middle School
- Brea Olinda High School
Utilities
- Forced Air Heating and Cooling System
Listing and Financial Details
- Tax Lot 1
- Tax Tract Number 10506
- Assessor Parcel Number 93760046
- $387 per year additional tax assessments
Community Details
Overview
- 77 Units
- Brea Canyon Villas Association, Phone Number (888) 390-6564
- Bentley HOA
- Brea Canyon Villas Subdivision
Recreation
- Community Pool
- Community Spa
Map
Home Values in the Area
Average Home Value in this Area
Tax History
| Year | Tax Paid | Tax Assessment Tax Assessment Total Assessment is a certain percentage of the fair market value that is determined by local assessors to be the total taxable value of land and additions on the property. | Land | Improvement |
|---|---|---|---|---|
| 2025 | $4,057 | $341,507 | $231,020 | $110,487 |
| 2024 | $4,057 | $334,811 | $226,490 | $108,321 |
| 2023 | $3,944 | $328,247 | $222,049 | $106,198 |
| 2022 | $3,904 | $321,811 | $217,695 | $104,116 |
| 2021 | $3,832 | $315,501 | $213,426 | $102,075 |
| 2020 | $3,806 | $312,266 | $211,237 | $101,029 |
| 2019 | $3,708 | $306,144 | $207,095 | $99,049 |
| 2018 | $3,653 | $300,142 | $203,035 | $97,107 |
| 2017 | $3,586 | $294,257 | $199,054 | $95,203 |
| 2016 | $3,434 | $281,000 | $195,151 | $85,849 |
| 2015 | $3,433 | $281,000 | $196,877 | $84,123 |
| 2014 | $2,714 | $218,550 | $134,427 | $84,123 |
Property History
| Date | Event | Price | List to Sale | Price per Sq Ft |
|---|---|---|---|---|
| 11/22/2025 11/22/25 | Pending | -- | -- | -- |
| 11/02/2025 11/02/25 | Price Changed | $489,900 | -2.0% | $576 / Sq Ft |
| 10/22/2025 10/22/25 | For Sale | $500,000 | -- | $588 / Sq Ft |
Purchase History
| Date | Type | Sale Price | Title Company |
|---|---|---|---|
| Interfamily Deed Transfer | -- | First American Title Company | |
| Grant Deed | $265,000 | Fidelity Title Company | |
| Grant Deed | $189,000 | Old Republic Title Company |
Mortgage History
| Date | Status | Loan Amount | Loan Type |
|---|---|---|---|
| Previous Owner | $195,000 | Purchase Money Mortgage | |
| Previous Owner | $189,000 | No Value Available |
Source: California Regional Multiple Listing Service (CRMLS)
MLS Number: PW25239584
APN: 937-600-46
Disclaimer: Certain information contained herein is derived from information provided by parties other than Homes.com. All information provided is deemed reliable, but is not guaranteed to be accurate and should be independently verified.
![]() The multiple listing data appearing on this website, or contained in reports produced therefrom, is owned and copyrighted by California Regional Multiple Listing Service, Inc. ("CRMLS") and is protected by all applicable copyright laws. Information provided is for viewer's personal, non-commercial use and may not be used for any purpose other than to identify prospective properties the viewer may be interested in purchasing. All listing data, including but not limited to square footage and lot size is believed to be accurate, but the listing Agent, listing Broker and CRMLS and its affiliates do not warrant or guarantee such accuracy. The viewer should independently verify the listed data prior to making any decisions based on such information by personal inspection and/or contacting a real estate professional.
The multiple listing data appearing on this website, or contained in reports produced therefrom, is owned and copyrighted by California Regional Multiple Listing Service, Inc. ("CRMLS") and is protected by all applicable copyright laws. Information provided is for viewer's personal, non-commercial use and may not be used for any purpose other than to identify prospective properties the viewer may be interested in purchasing. All listing data, including but not limited to square footage and lot size is believed to be accurate, but the listing Agent, listing Broker and CRMLS and its affiliates do not warrant or guarantee such accuracy. The viewer should independently verify the listed data prior to making any decisions based on such information by personal inspection and/or contacting a real estate professional.
Based on information from California Regional Multiple Listing Service, Inc. and /or other sources. All data, including all measurements and calculations of area, is obtained from various sources and has not been, and will not be, verified by broker or MLS. All information should be independently reviewed and verified for accuracy. Properties may or may not be listed by the office/agent presenting the information
- 242 Mountain Ct
- 748 Ashby Ln Unit 55
- 273 Mountain Ct
- 329 Surry Ct
- 783 Driftwood Ave
- 714 Brooklyn Dr
- 909 Orangewood Dr
- 490 Buttonwood Dr
- 273 Saint Crispen Ave
- 448 W Central Ave
- 426 W Central Ave
- 931 Kings Canyon Rd
- 604 E Ash St
- 1051 Site Dr Unit 255
- 1051 Site Dr Unit 89
- 1051 Site Dr Unit 203
- 1051 Site Dr Unit 233
- 879 Shadowgrove St
- 320 S Redwood Ave
- 404 Sievers Ave