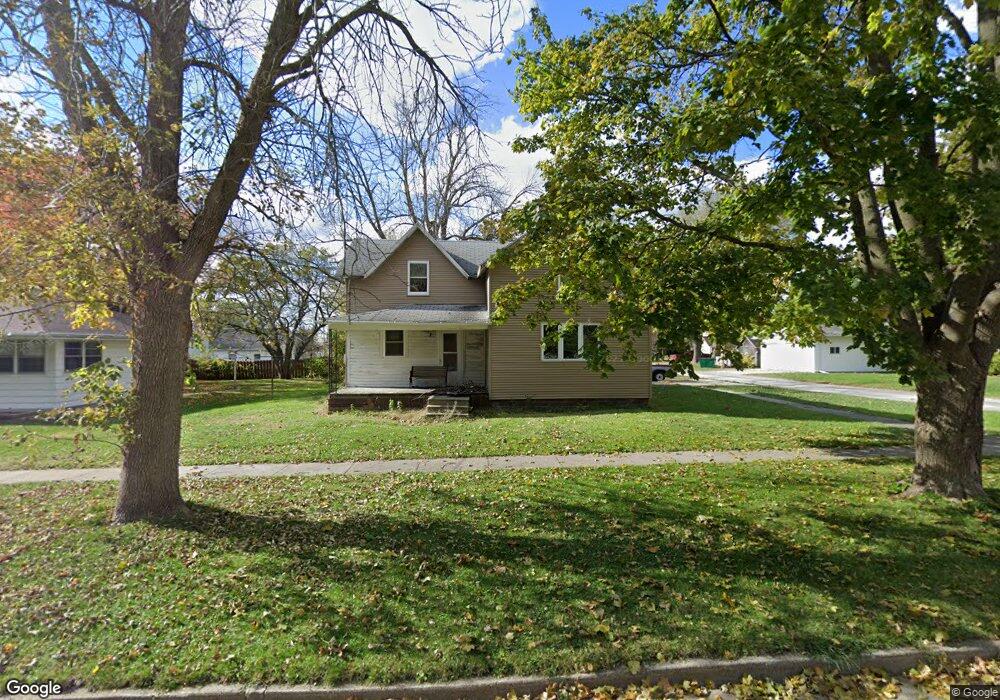
600 S 4th St Montezuma, IA 50171
Estimated Value: $44,000 - $211,000
4
Beds
1
Bath
1,382
Sq Ft
$81/Sq Ft
Est. Value
About This Home
This home is located at 600 S 4th St, Montezuma, IA 50171 and is currently estimated at $111,418, approximately $80 per square foot. 600 S 4th St is a home with nearby schools including Montezuma Elementary School and Montezuma Junior High School.
Ownership History
Date
Name
Owned For
Owner Type
Purchase Details
Closed on
Jun 29, 2022
Sold by
Talbert Ricky E
Bought by
Bru Kevin L
Current Estimated Value
Purchase Details
Closed on
Aug 28, 2013
Sold by
Montezuma State Bank
Bought by
Talbert Ricky E
Home Financials for this Owner
Home Financials are based on the most recent Mortgage that was taken out on this home.
Original Mortgage
$26,000
Interest Rate
4.33%
Mortgage Type
Future Advance Clause Open End Mortgage
Create a Home Valuation Report for This Property
The Home Valuation Report is an in-depth analysis detailing your home's value as well as a comparison with similar homes in the area
Home Values in the Area
Average Home Value in this Area
Purchase History
| Date | Buyer | Sale Price | Title Company |
|---|---|---|---|
| Bru Kevin L | $36,000 | None Listed On Document | |
| Talbert Ricky E | $35,000 | None Available |
Source: Public Records
Mortgage History
| Date | Status | Borrower | Loan Amount |
|---|---|---|---|
| Previous Owner | Talbert Ricky E | $26,000 |
Source: Public Records
Tax History Compared to Growth
Tax History
| Year | Tax Paid | Tax Assessment Tax Assessment Total Assessment is a certain percentage of the fair market value that is determined by local assessors to be the total taxable value of land and additions on the property. | Land | Improvement |
|---|---|---|---|---|
| 2025 | $688 | $50,420 | $14,260 | $36,160 |
| 2024 | $728 | $46,940 | $12,670 | $34,270 |
| 2023 | $838 | $46,940 | $12,670 | $34,270 |
| 2022 | $820 | $44,760 | $10,070 | $34,690 |
| 2021 | $820 | $42,230 | $9,500 | $32,730 |
| 2020 | $856 | $42,230 | $9,500 | $32,730 |
| 2019 | $880 | $45,200 | $9,500 | $35,700 |
| 2018 | $868 | $45,200 | $9,500 | $35,700 |
| 2017 | $836 | $45,200 | $9,500 | $35,700 |
| 2016 | $864 | $45,200 | $9,500 | $35,700 |
| 2015 | -- | $45,200 | $9,500 | $35,700 |
| 2014 | -- | $45,200 | $9,500 | $35,700 |
Source: Public Records
Map
Nearby Homes